

The big European sort? The diverging fortunes of Europe's regions
- Much ink has been spilled over the economic causes of the EU’s political problems. Many point towards high levels of income inequality, and the financial and euro crises. Fewer have considered how structural economic changes have led to regional divergence – with profitable companies and highly-skilled people clustering together in successful cities, leaving less successful areas behind.
- The interactive map below illustrates Europe’s economic fault-lines. It shows regional productivity, measured by economic output per worker: the deeper the blue, the higher the region’s productivity as a percentage of the EU average, while the deeper the red, the lower. It shows that many regions in richer countries are far less productive than the EU average, and some places in poorer countries are more productive than that average. By clicking on a region, you can see more information about how it compares to the rest of Europe. Many UK regions have similar productivity to countries in Southern Europe. These countries were badly hit by the Great Recession.
Through a modelling exercise, we have also estimated how productive a region ‘should’ be, given the age of its population, how many of its residents are graduates, how close geographically the region is to the economic core of the EU or the region’s country, and how densely settled the region is. That is displayed on the second map. According to our modelling, the worst performing European region is Berlin: it is a favoured destination for young graduates, but has not yet translated that into the higher levels of productivity seen in most capitals in Europe. Many post-industrial towns and cities are not much better: many have not found a niche in an economy that is increasingly dominated by the services sector.
- Over the last four decades, Europe has seen diverging fortunes among its rural regions, towns and cities. But the much-discussed ‘rural-urban divide’ is too simple, and does not fit the data. Nor has economic integration in the EU led to greater divergence across regions, on average. Growth in industrial output has been stronger in the countryside and towns in Western Europe, and spread evenly across regions in Central and Eastern Europe. But high-value services have become more concentrated in successful cities in the West, especially since the financial crisis.
- In the 1980s and 1990s, industrial heartlands such as the Ruhr Area in Germany suffered from relative – and in some cases, absolute – decline in industrial output. The largest cities and regions near them – often capitals such as Paris or London – were able to replace declining industrial production with high-value services, especially tradable services such as finance, tech, culture and advertising, and in some cases, such as Munich, also with high-tech manufacturing.
- The increasing concentration of services can also be seen in corporate profit data. Bloomberg Economics estimates show that the concentration of profits among the top firms has not been driven by size or market power, but rather by the sector in which the firms operate. Tech, healthcare and communications are the sectors in Europe with the strongest divergence in profits between the top and the median firm.
- The most important question is: what makes a successful region? With a new regression analysis, we show that high productivity levels in regions are associated with three factors: they are part of – or geographically close to – successful cities; a larger proportion of their workforce are graduates; and their populations are younger. The association of a high share of graduates with productivity levels is also rising over time. This will, in turn, encourage more young graduates to move to places that are already successful.
- This creates a dilemma for Europe’s policy-makers. Should they attempt to invest in areas in relative decline, to try to stem the outflow of highly-skilled people and address the frustration of people ‘left behind’? Or should they invest more in skills, housing and transport to make it easier for people to move to successful cities? While the latter might lead to the largest productivity gains, it risks hardening Europe’s political fault-lines.
This paper is the first in a major new CER project, ‘Growing together: the Angelopoulos project on the future of the European economy’. In future papers, we will consider how technological changes and globalisation might affect growth and inequality across the EU’s member-states and regions, and whether these changes will tend to aggravate or soothe political tensions in Europe.
The EU is blamed from left and right for an economy that does not work for all. Right-wing populists, to the extent they have a coherent economic programme, tend to view the EU’s economic regime as a constraint on their ability to deliver ‘the will of the people’, which they alone can discern. The left rails against the ‘neoliberalism’ of EU rules, especially those that constrain fiscal spending and enforce openness to trade and investment, which they blame for high levels of inequality and unemployment, and weak growth.
This paper, the first in a series on the future of the European economy, is an attempt to map out inequality in Europe. We look at inequality across and within countries, to sketch the extent to which the modern European economy is creating divergence between countries, people, firms and regions.
We find that the key to understanding the political problems that the European economy has created is to think spatially: neither countries nor individuals are the only relevant unit of analysis. Inequalities of income between countries and individuals are certainly a problem, but they have not been growing in recent years. Smaller regional units such as cities and counties help us to understand what is really going on: regional divergence over the past decades is linked to the decline of manufacturing and heavy industry, and the rise of the services economy, which is increasingly dominated by successful ‘city-regions’ that attract the young and well-educated. That process only started in the mid-2000s in Europe, and may well intensify in the future.
The architects of European integration always feared that it would lead to greater inequality between the regions of Europe. One of the main aims of the EU has always been to ease the sale of goods and services across the Union, and to encourage workers and capital to flow to the places where they can best be deployed. While this should, on average, increase economic welfare, it may mean that some people and regions become relatively more successful, creating resentment among people left behind in poorer places.
Consider commerce within – as opposed to between – countries. Cities grew enormously after the industrial revolution because it was more efficient for labour and capital to cluster together. Workers could enjoy a range of job opportunities, and if they lost one job, they could find another. Employers – and the people providing them with finance to expand production – could grow their businesses more speedily if they had a larger supply of labour upon which to draw, and they could more easily share, sell or steal ideas and technology in a city than if they were isolated in the countryside.
Technology and trade fed cities’ growth; improvements in shipping, railways and roads allowed companies to produce in a city and then ship goods around the country or overseas. The history of industrialisation has been as much about the growth of cities as it has been about mechanisation or the exchange of goods across borders. And cities beget regional inequality – between successful cities and less successful ones, and between cities, towns and the countryside.
But there may be differences between sectors. Goods production is more easily ‘spreadable’ across space. Western companies produce goods in China because labour is cheap and abundant. Southern and Central-East Europe have benefited from more integrated European goods markets, because they have been able to attract manufacturing capital, such as German car companies, looking for cheap land and lower wages. And the integrated EU market means that they can distribute finished cars and car parts across Europe with little hindrance – and the value of their investments are unlikely to be damaged by government taxes or regulations designed to discriminate against foreign companies.
Services, with some notable exceptions, are less easy to produce and consume across space – you have to go to a salon to get a haircut, talk regularly to your colleagues when conducting research, and be assured that a lawyer knows the law in your country and is qualified to offer you advice. The richer cities in Europe used to be large industrial hubs too, but have shifted towards services in the last 40 years. Today, these cities are dominated by high value-added services workers (lawyers, IT specialists, bankers, consultants and so on) and high-tech manufacturing, but also contain a vast number of more poorly paid workers providing cleaning, distribution, hospitality and myriad other services. Services can create a hollowed-out labour market: high and low-paid jobs, with little in between.
As a result, the denizens of Europe’s successful cities are likely to be younger, more highly educated and richer than Europeans who live in less successful cities and towns. Less successful places are losing people, especially in countries with ageing demographics. The political effects of regional sorting are predictable: frustration at relative economic decline in poorer regions, a sense of loss of community as younger people leave, and grievance about metropolitan ‘elites’ running the country for their own benefit.
In the sections that follow, we examine the data on income inequality, broadly defined: between individuals, countries, businesses and regions. We find that the rise of the services economy is the cause of growing regional inequality. In a services-dominated economy, centripetal forces (that encourage capital and high-skilled labour to cluster together geographically) overwhelm centrifugal forces (whereby capital chases ever cheaper land and labour). We have dubbed this winnowing of Europe’s people and capital into rich and poor regions the ‘big European sort’, as a nod to Bill Bishop’s book about population movements and political polarisation in the United States.2 He argues that more highly educated, liberal and often younger people, and less-educated, conservative and older people are increasingly living together, with the former moving to richer cities, and the latter to suburbs, smaller towns and rural areas. Our focus is on the economics of sorting, but we conclude with some points about why it matters politically, and the dilemmas it throws up for economic policy-makers.
Income inequality in Europe
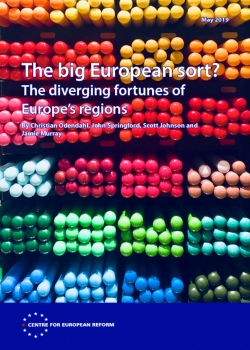
Many blame rising income inequality for the EU’s political crises. It is at a very high level, but has been fairly static for two decades. Between 1980 and 2000, income inequality grew significantly in most large European countries, apart from France. Chart 1 shows the ‘Gini index’ of inequality, a measure of the distribution of income, before the government imposes taxes or redistributes income to poorer households.3 In 1970, the UK was the most equal of our countries, but after the Thatcherite experiment, it was one of the least. Inequality in Poland leapt after its transition to capitalism, while Italy and Germany tracked the US, with a steady rise. After 2000, the rise in inequality slowed or went into reverse in most countries.
The structure of developed economies has produced a remarkably similar level of pre-tax inequality since the turn of the millennium. As Martin Sandbu of the Financial Times has pointed out, this suggests that the period of hyperglobalisation after 1995, as China and other emerging economies entered global markets, cannot have been the main culprit for rising inequality: inequality as measured by the Gini index hardly changed during that period. Technological change and other factors must have been more important.4
What is more, while frustration at high levels of inequality may well have driven part of the populist backlash after the financial crisis, rising inequality was not the problem: it had fallen or stagnated in Poland, Italy and the UK, countries which have proven particularly open to right-wing populism. And European governments continue to do far more to redistribute income than is the case in the US, with only Germany seeing a sizeable rise in post-tax-and-transfers inequality since the turn of the millennium.
The evidence on income inequality is clear: the relationship between rising inequality and globalisation – or integration with the EU – is weak. The rise in inequality predated the period when globalisation was running at its fastest, and integration with the EU did not necessarily result in rising income inequality either.
At the national level, the story of the EU has been one of convergence, not divergence. Poorer countries have a tendency to catch up with richer ones, especially if they integrate with the global economy, for two reasons. They can use their ‘comparative advantage’ to produce goods and services they are relatively better at producing, and exchange those for imports such as technology and machines invented by their richer peers. And second, they can attract foreign investment to develop their capital stock, which makes them more productive.
Most of the poorer countries of Europe that abandoned communism in 1989 and 1990 quickly became candidate countries for accession to the EU. Accession countries and existing member-states opened their markets to one another, while accession countries were required to align with EU rules on democracy, the rule of law and the management of a market economy. The Central and East European member-states joined the EU in 2004, 2007 and (in Croatia’s case) 2013.
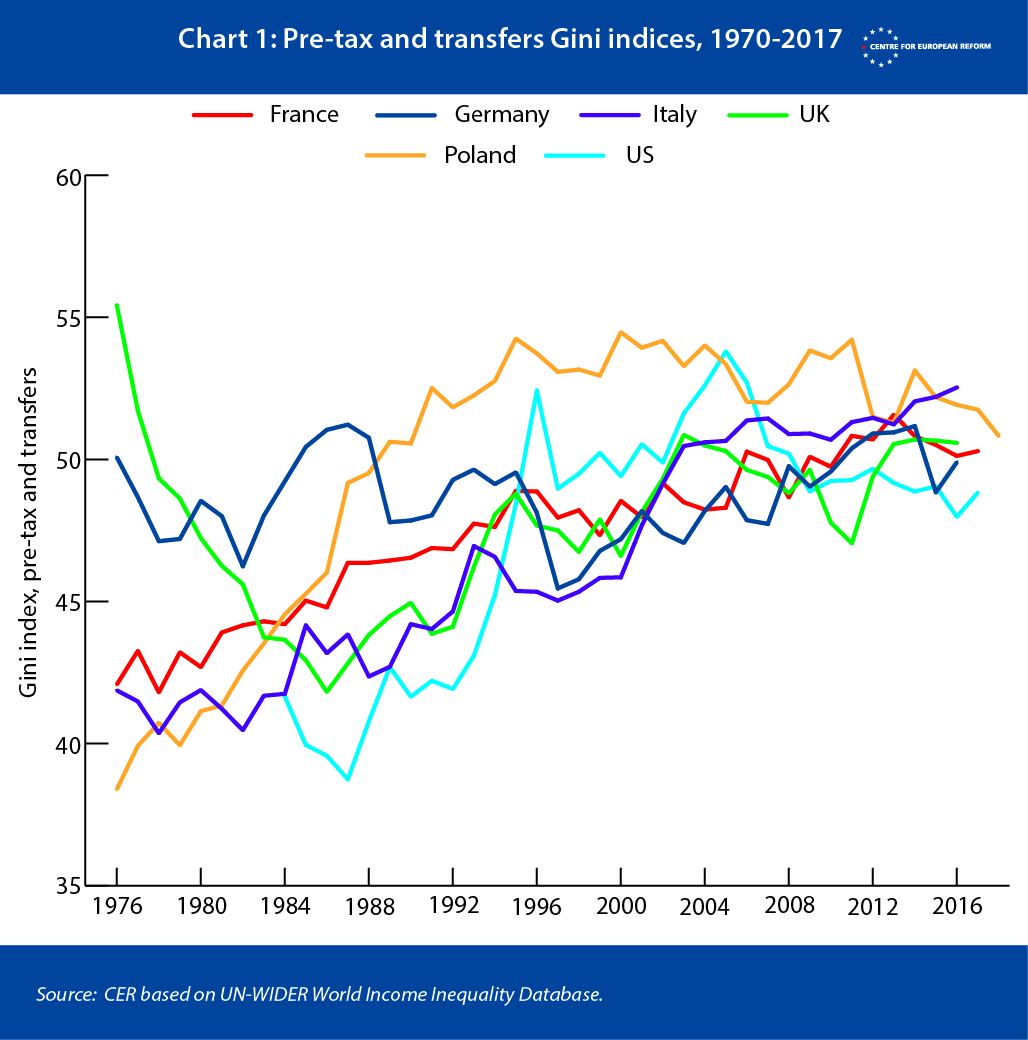
The effects were dramatic (see Chart 2). Between 1995 and 2008, per capita incomes in the new member-states rose from one-third to one-half of the EU-28 average. After the crash, convergence continued, albeit more slowly. By 2017, they hit 60 per cent of the EU average. But the story for the older member-states is not so rosy. In the decade before 2008, there was no convergence between Southern and Northern Europe. And after the euro crisis, per capita incomes in Spain, Italy, Portugal and Greece plunged to 80 per cent of the EU average.
The reason for divergence within the eurozone after 2008 is well known, and we will not repeat it at length here. After the crash, monetary and fiscal policy were too restrictive to prevent a second eurozone recession, with southern countries suffering the most. These countries did not control their own currency, and were forced to cut back on spending because investors feared that some of them could be forced out of the eurozone. It was only in 2012, when Europe threw some dogmas out of the window, that the eurozone stabilised: the European Central Bank promised to lend to governments to ensure that doubts about their solvency did not spiral out of control; fiscal rules were applied with less rigour; and Europe’s decision to pool banking supervision, resolution and insurance – although that project remains incomplete – showed that the eurozone was finally tackling some of the key weaknesses of its architecture. Still, the damage was done. While growth has returned to Spain and Portugal, Greece and Italy are still struggling with a high debt burden and a low structural rate of growth.
Between the EU’s member-states then, there is little evidence that the single market – or openness to trade, investment and migration flows more generally – is causing divergence. If anything, the opposite is true. The divergence we have seen between northern and southern eurozone countries reflects the failure to deal with the euro’s flaws.
However, technological change and trade may have affected smaller regions – as opposed to countries – differently. Manufacturing and heavy industry’s share of European output had been falling before 1980 but accelerated thereafter, especially in Western Europe. Deindustrialisation should mean that output and incomes in industrial areas grow slower than in regions and cities specialising in services. Policies to curb union power and reduce inflation-busting pay awards should do the same, since unions are more powerful in industry than in the services sector. And the recovery of large cities, many of which had seen falling populations as people left for the suburbs from the 1950s, should lead to greater concentrations of skilled people and highly productive services businesses in certain successful places. Has this, in fact, happened?
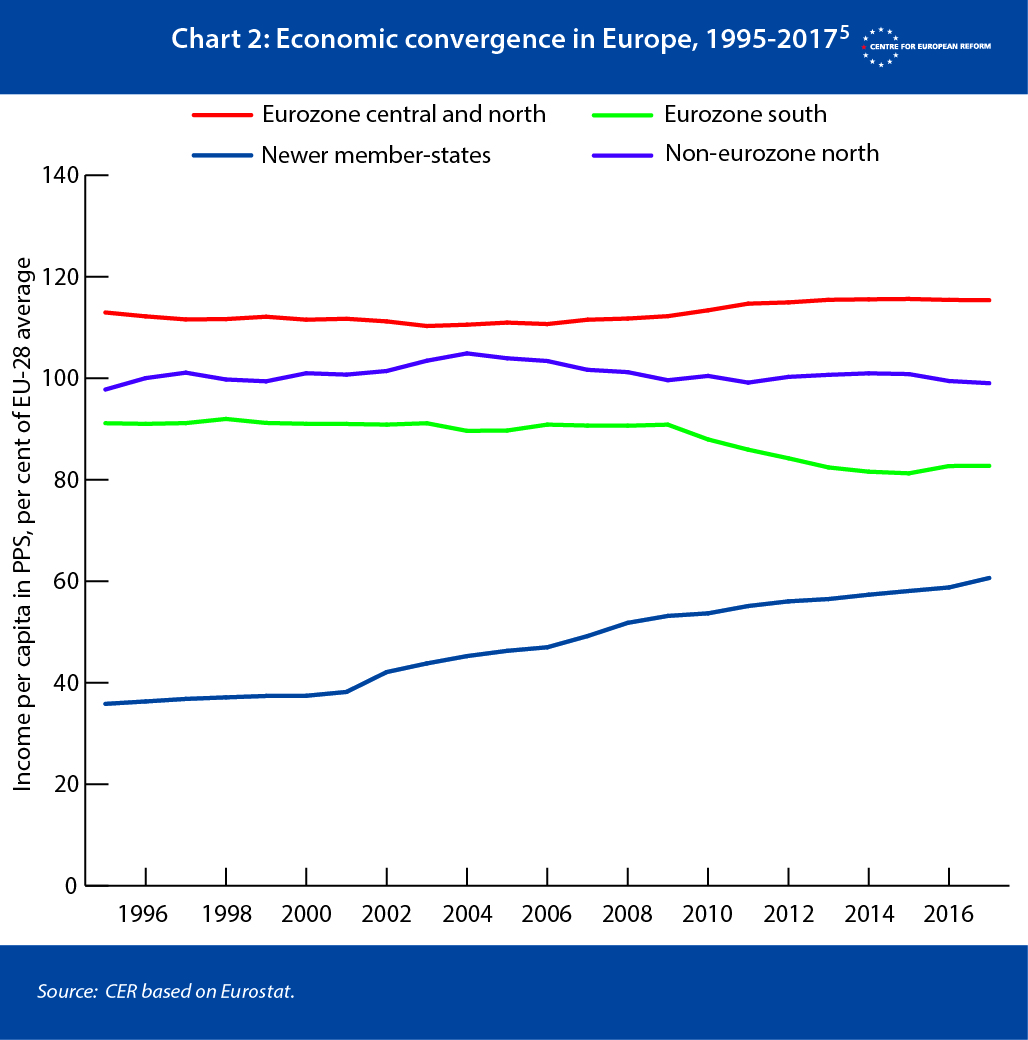
Charts 3 and 4 show that European integration has tended to reduce disparities in economic performance between regions. They show the extent of variation in regions’ economic output (measured by gross value-added, or GVA) between 1980 and 2015 (for Western EU regions) and between 1990 and 2015 (for Eastern EU regions).6 A high value means that output is concentrated in some regions. A declining value thus means that regions become more similar in levels of output over time.
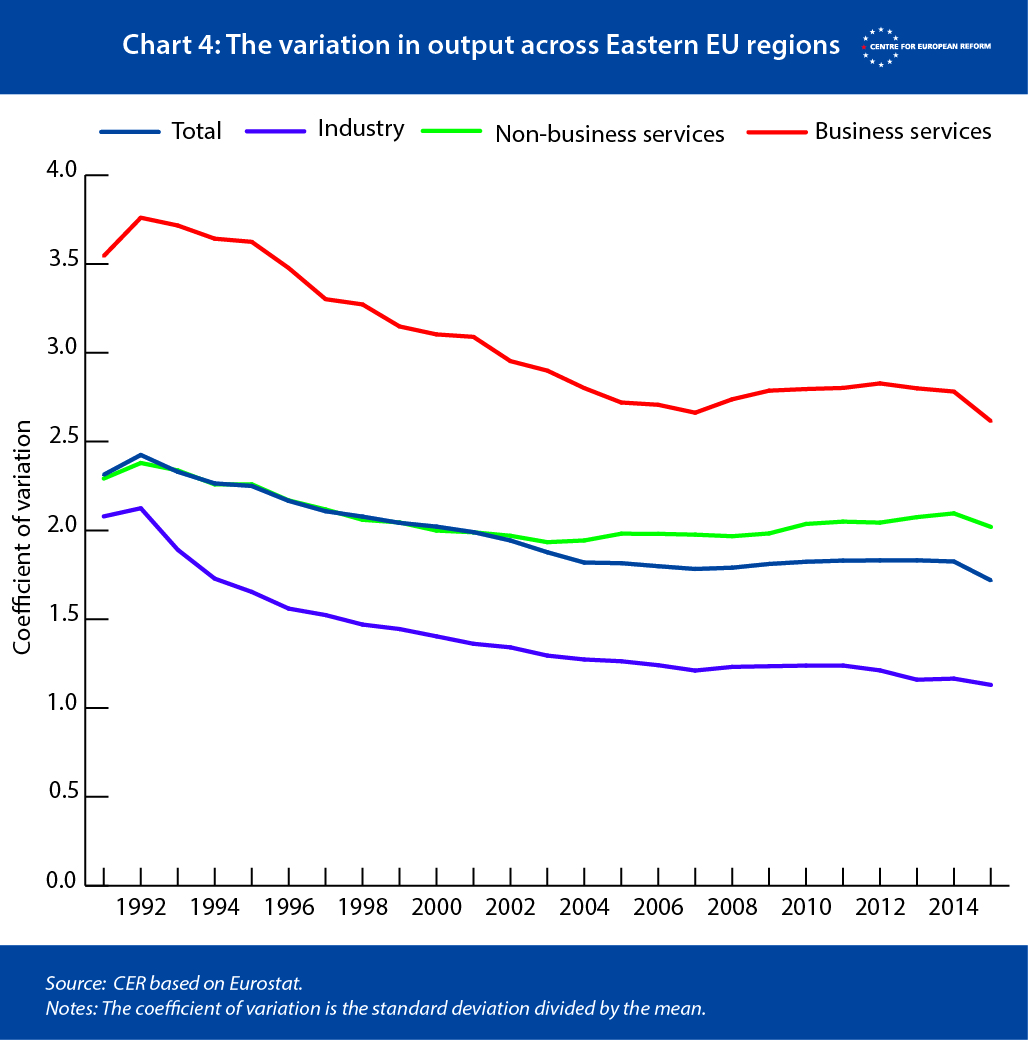
From these charts, we can observe two distinct phases. In the first phase, when sectors integrated with the EU, we see that economic activity in that sector spread out across EU regions, and disparities were reduced. In Western Europe, this process was fastest in industry (which includes heavy industry and manufacturing), and was complete by 1995. Business services – the most tradable services sector– took a decade longer. (This sector includes finance, accountancy and law.) But in the second phase, which began shortly before the financial crisis, inequality between regions rose again in business services, until it was almost back to where we started in 1980. This trend is most marked in the UK, France, the Netherlands and Italy, where economic activity in business services has become much more concentrated in some regions since the crisis.
Central and Eastern Europe is still in the ‘first’ phase of integration, where economic activity is increasingly spread out across regions. However, this convergence process stalled in services after the financial crisis, and has slowed considerably in industry.
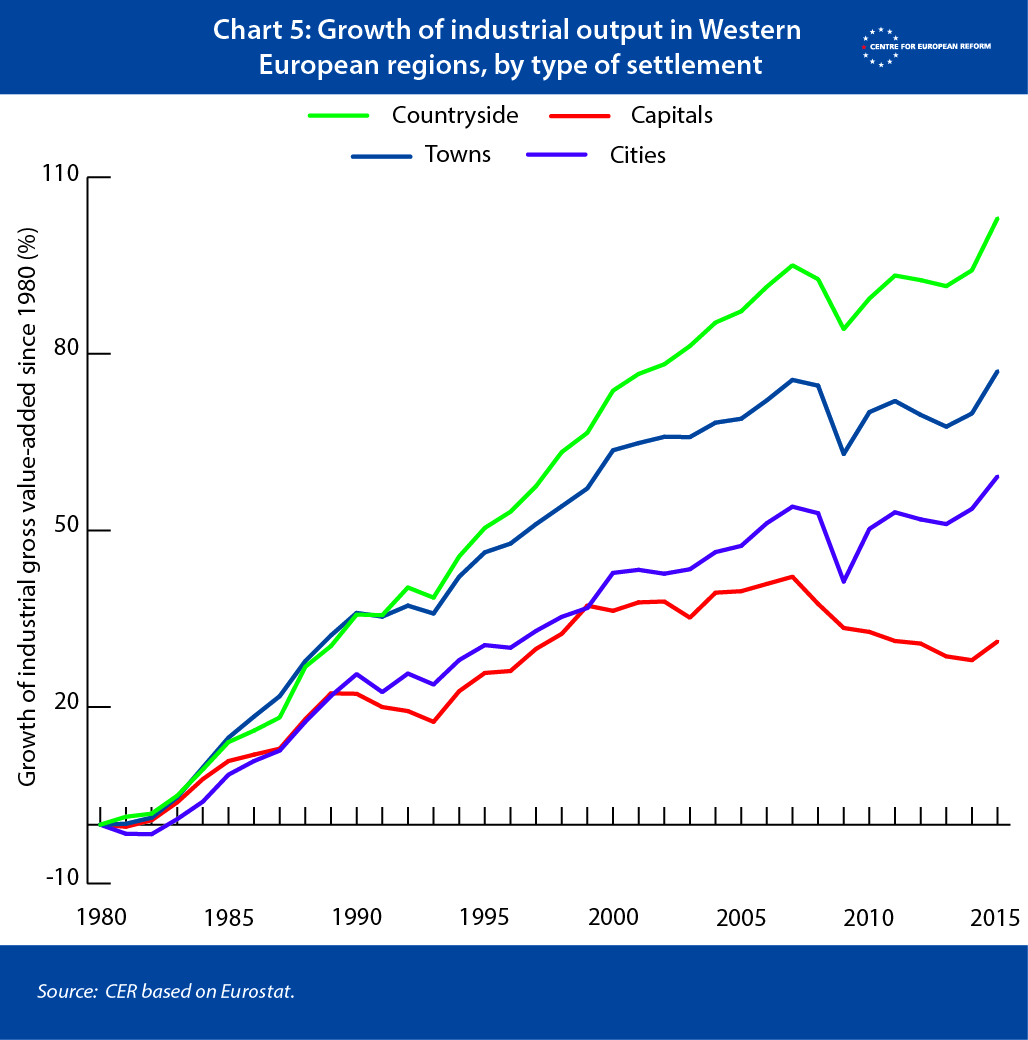
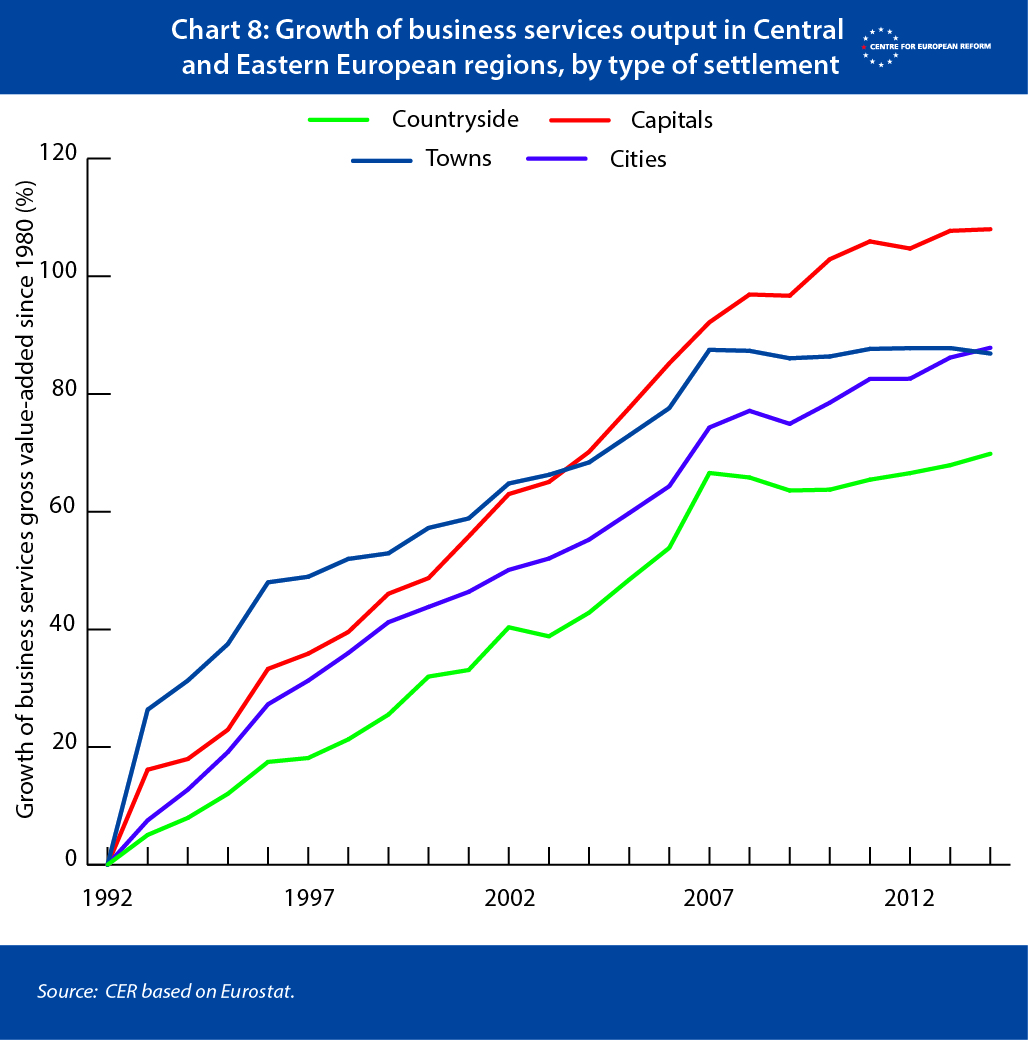
What is going on? As the manufacturing sector in Western Europe integrated and heavy industry fell into decline from the 1980s, we saw much faster growth in regions with smaller industrial economies to begin with: manufacturing output grew at a faster rate in the countryside and towns than in cities and capitals. Chart 5 shows the growth in real industrial output in Western Europe by the type of settlement, setting 1980 to zero.7 Industrial output in the countryside nearly doubled between 1980 and 2014, while in capital cities, it only grew by a quarter.
In Central and Eastern Europe the pattern has been quite different: industrial growth has been largely unrelated to the type of region, with rural and urban places both enjoying rapid growth.
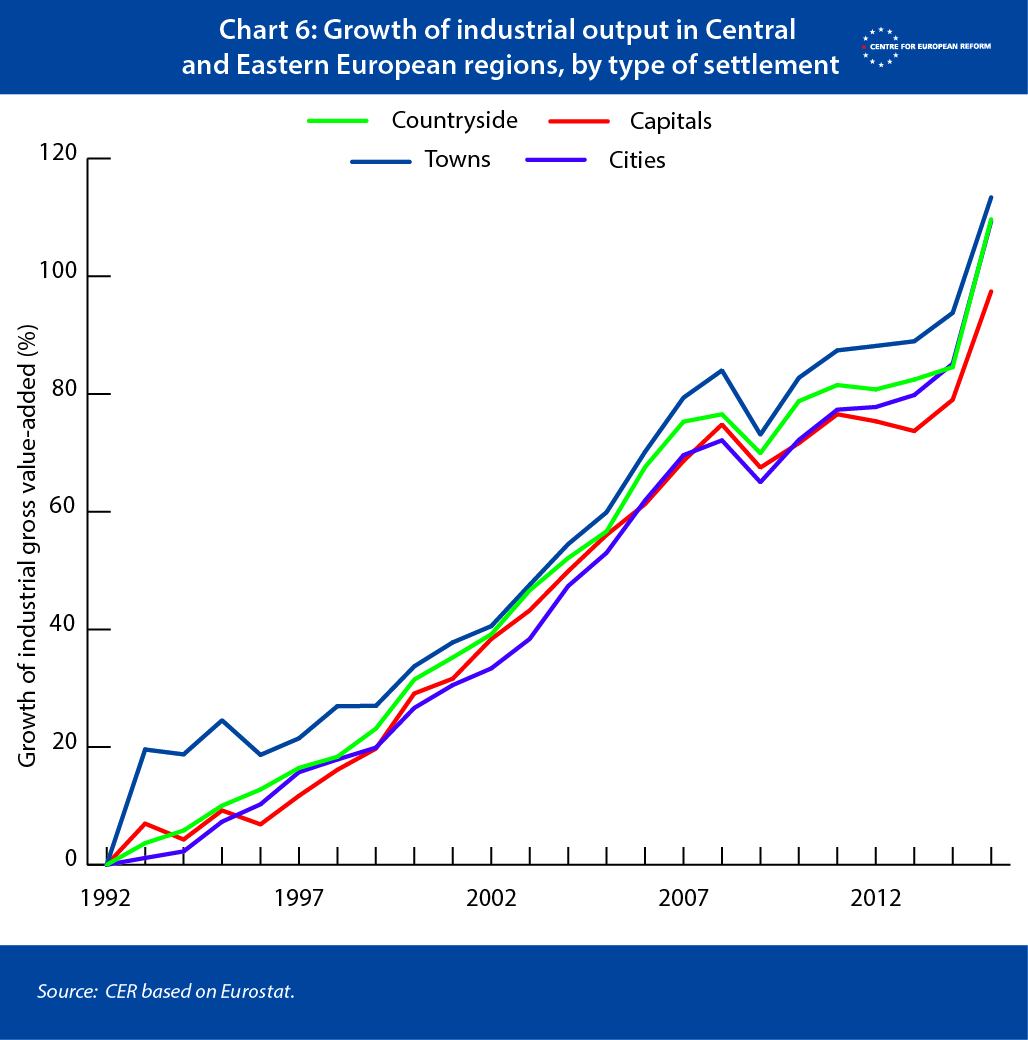
Why did this happen? The value of land and the price of labour played a big role. In the 1980s manufacturers shifted production to less densely populated areas in Western Europe, where land and labour were cheaper. The single market thus provided poorer countries and regions with an economic growth strategy: create better transport links and allow lower trade barriers to work their magic to attract industry. And after 1995, when Central and Eastern Europe started to integrate with the EU, Western European companies (often German) could take advantage of cheap land and labour costs there, and set up plants in regions that suited them.
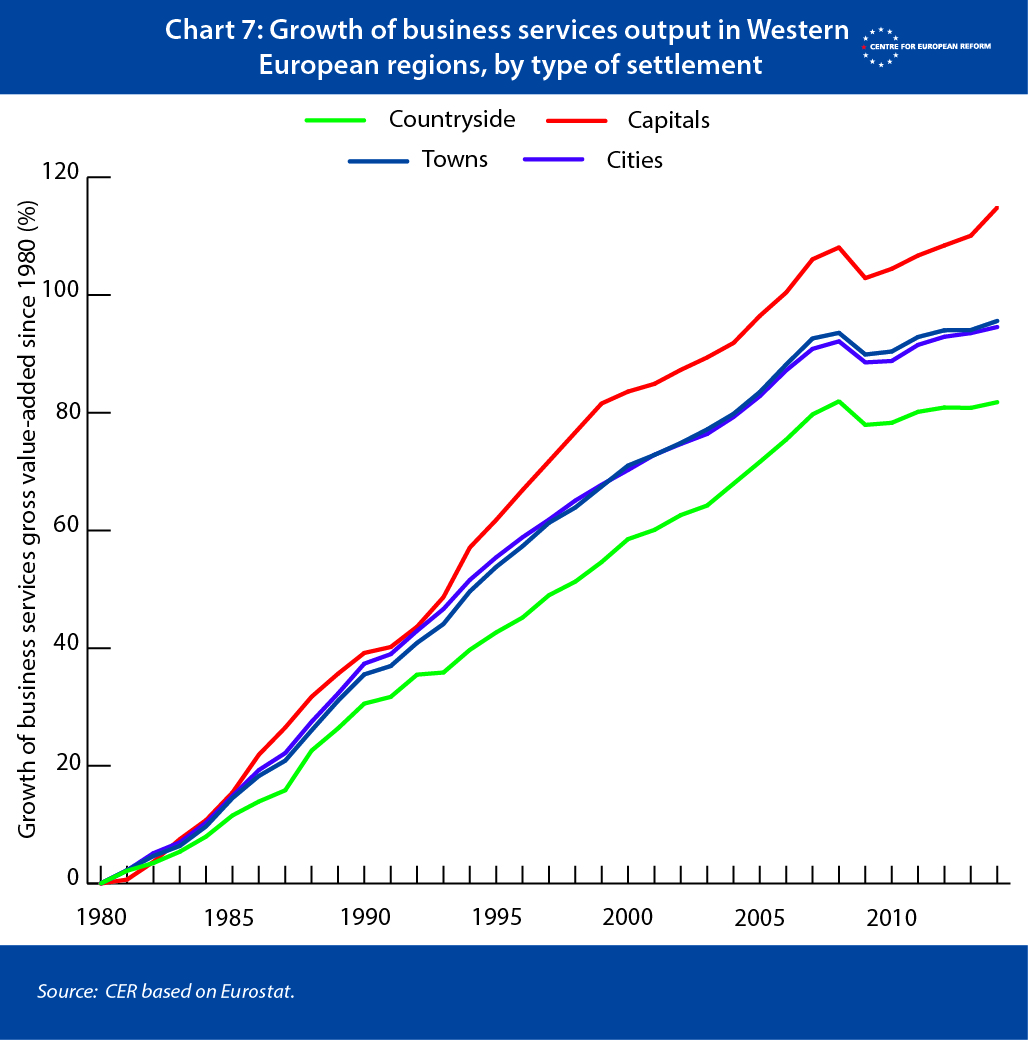
In business services, the pattern is quite different. In this sector, growth has been stronger in the more densely populated regions in west and east alike (see charts 7 and 8). Tradable services benefit most from close ‘agglomeration’ (social scientists’ jargon for people and business clustering together in space) in densely populated areas. Having a large labour pool of accountants attracts accountancy firms, for example, and the benefits of proximity trump the high cost of office space in rich cities.
The charts above lump together regions by pattern of settlement. But we can also look within these groups – especially cities – to examine which have coped with the relative decline of manufacturing and have taken advantage of stronger growth in the services sector.
Chart 9 shows the 35 regions with the biggest losses in industrial output (red bars) from 1980 to 1995, and the growth in services output over the same period (green bars). It also includes a measure of how important services were in the early 1980s (blue bars – a value of five means services firms produced five times as much output as industry in that region).
Roughly speaking, there are two types of regions that lost industrial output. The first are large cities, such as Paris, Munich, parts of London,8 Hamburg and Amsterdam, which already had a high share of services in the 1980s. They managed to move labour and capital out of manufacturing into services. The second are the industrial heartland cities, mostly in Germany (such as the Ruhr cities of Bochum, Recklingshausen and Duisburg), which struggled to compensate for the decline of industry and could not build on a strong services base.
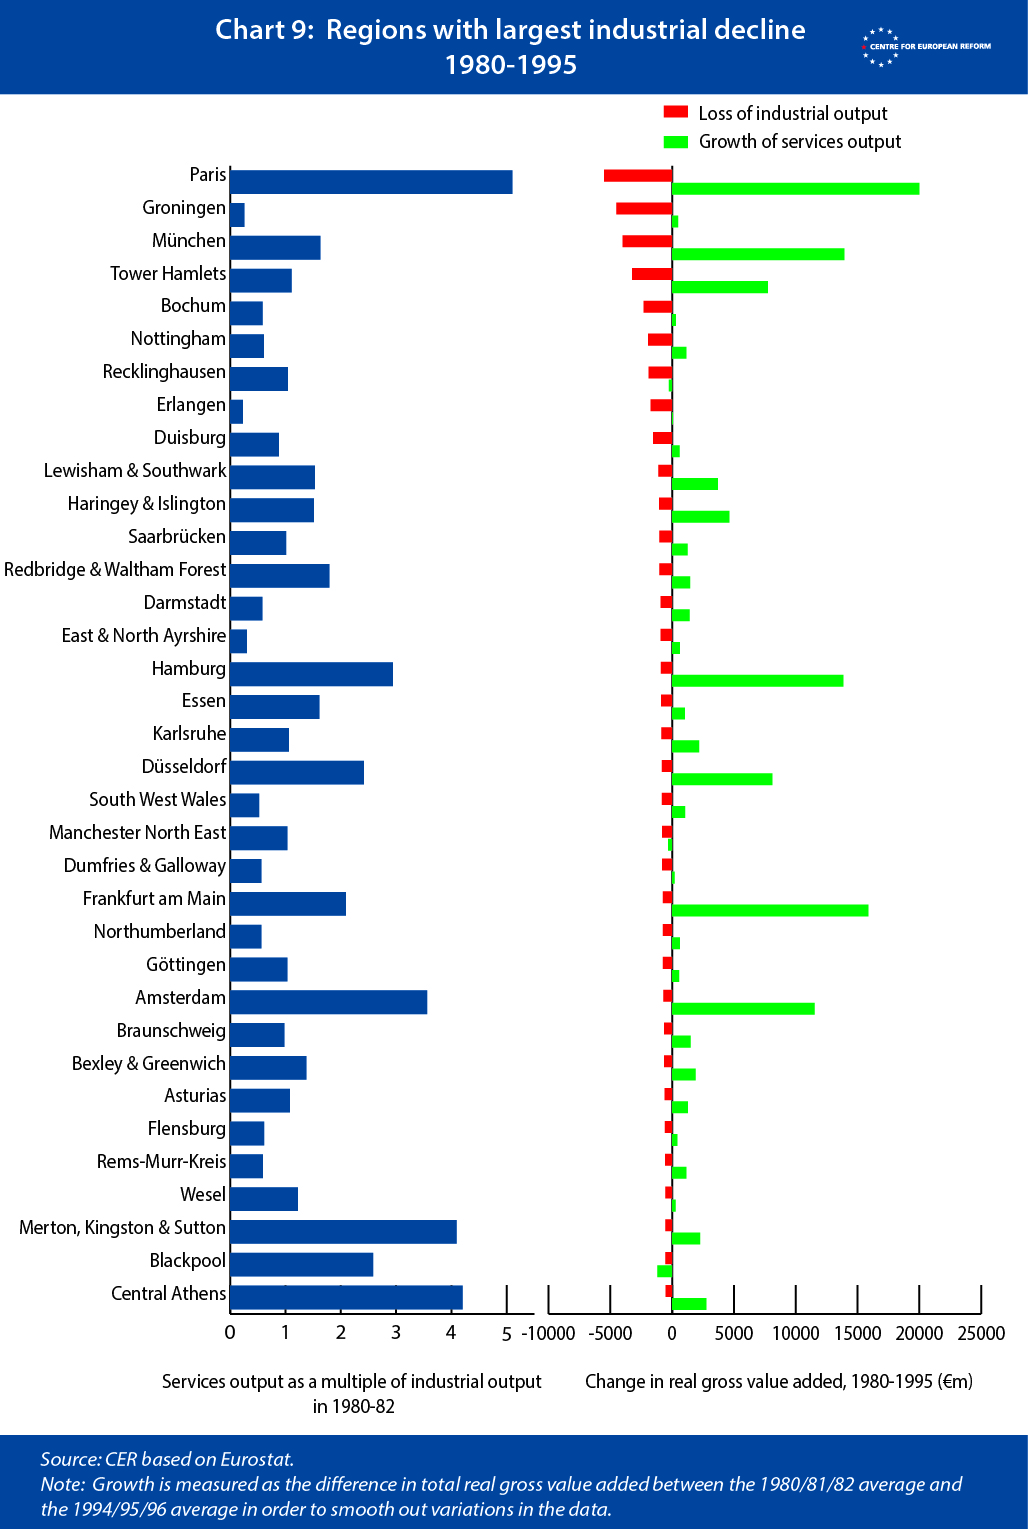
In the period since 1995, industrial decline has largely stopped, but the pattern of services growth remains similar: those large cities with large services sectors in 1995 have managed to compensate for the slight decline in industrial output. And large cities are among the best-performing industrial regions after 1995, reflecting growth in modern, high-tech manufacturing, which requires high-skilled labour. The strongest growth in services has been in larger cities since 1995, including Madrid, Hauts-de-Seine (the suburb of Paris that includes La Défense), London, Dublin, Milan, Barcelona, Amsterdam and so forth.
Taking stock: regional divergence in Europe is not a simple urban versus rural story. It is more complex. On average, divergence between regions has not increased. In the East, industrial growth has happened across the board; towns and the countryside in the West have seen decent growth in industry, too. But under the surface of averages is a worrying trend: large metropolitan and capital cities offset industrial decline with strong services growth; the old industrial heartlands, which include larger cities, struggled to compensate. Modern manufacturing growth seems to benefit larger cities and their surroundings, too. And since the crisis, divergence in services growth has picked up again.
Diverging corporate profits
There is a further dimension of divergence to consider: between top-performing companies in Europe, and laggards. And that gap has widened, as the following analysis using Bloomberg Economics data shows. Chart 10 shows the distribution of corporate profits (measured by return on invested capital). The profits of the top-performing companies – shown by the 90th percentile line on the chart – have grown much faster than the rest.
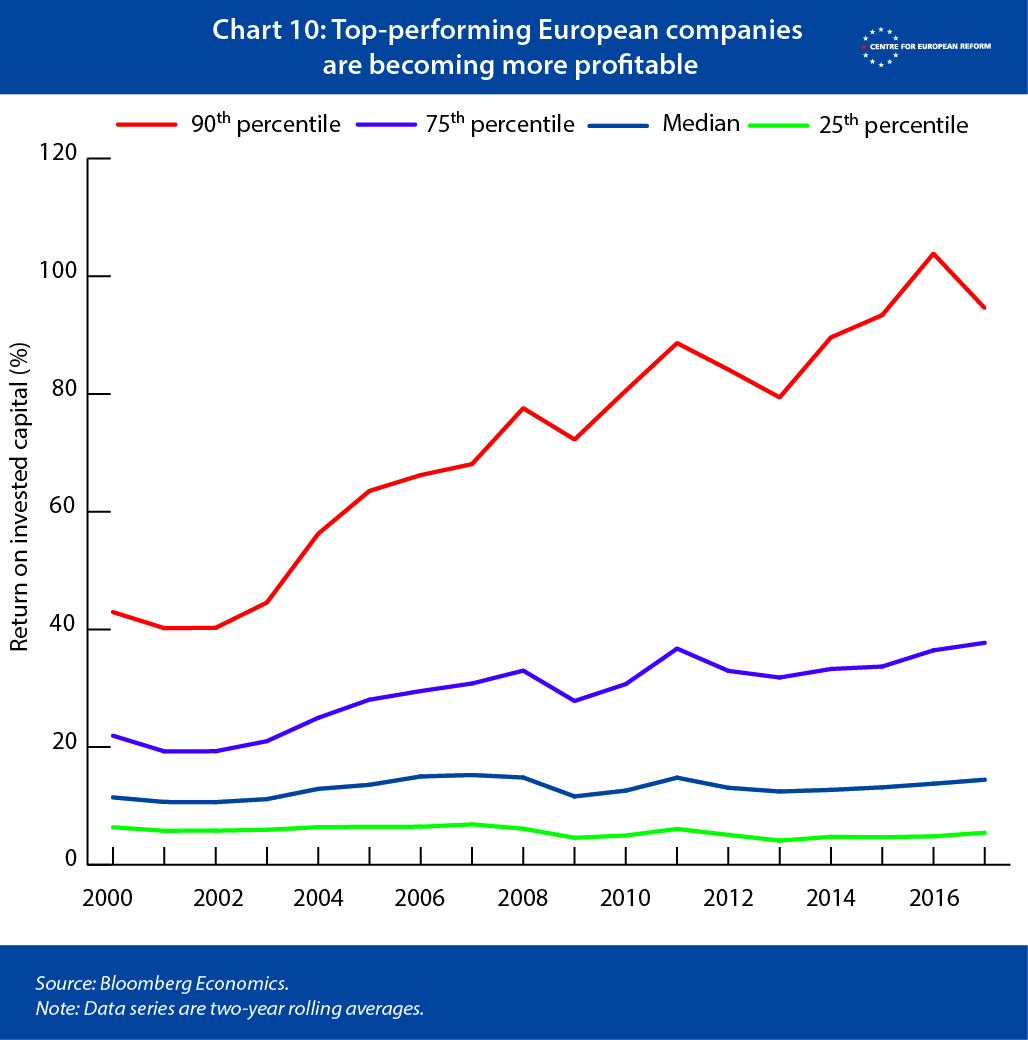
What explains this pattern? One might assume that gigantic companies are simply reaping bigger and bigger rents from their uncurbed market power. But the increasing profits at the top is unrelated to size: if anything, top-performing small companies have been doing better than the giants (Chart 11).

If it were large firms pulling away from the rest, we would expect the share of total revenue in the top decile to grow over time. If anything, this share has fallen slightly, meaning the average top-performing firm has not grown in size. There has also been relatively steady movement of firms in and out of the top bracket from year to year, suggesting that barriers to success have not become drastically bigger over the last 20 years.
The key insight is that the gap in profitability depends on the sector the company is operating in. Profit inequality between services companies far outstrips that of the manufacturing sector (Chart 12). We see the most pronounced skew in profits among technology, communications and healthcare companies. Technology makes up about 13 per cent of the overall sample but 30 per cent of the top decile, with most of those high-flying firms specialising in software (Chart 13).

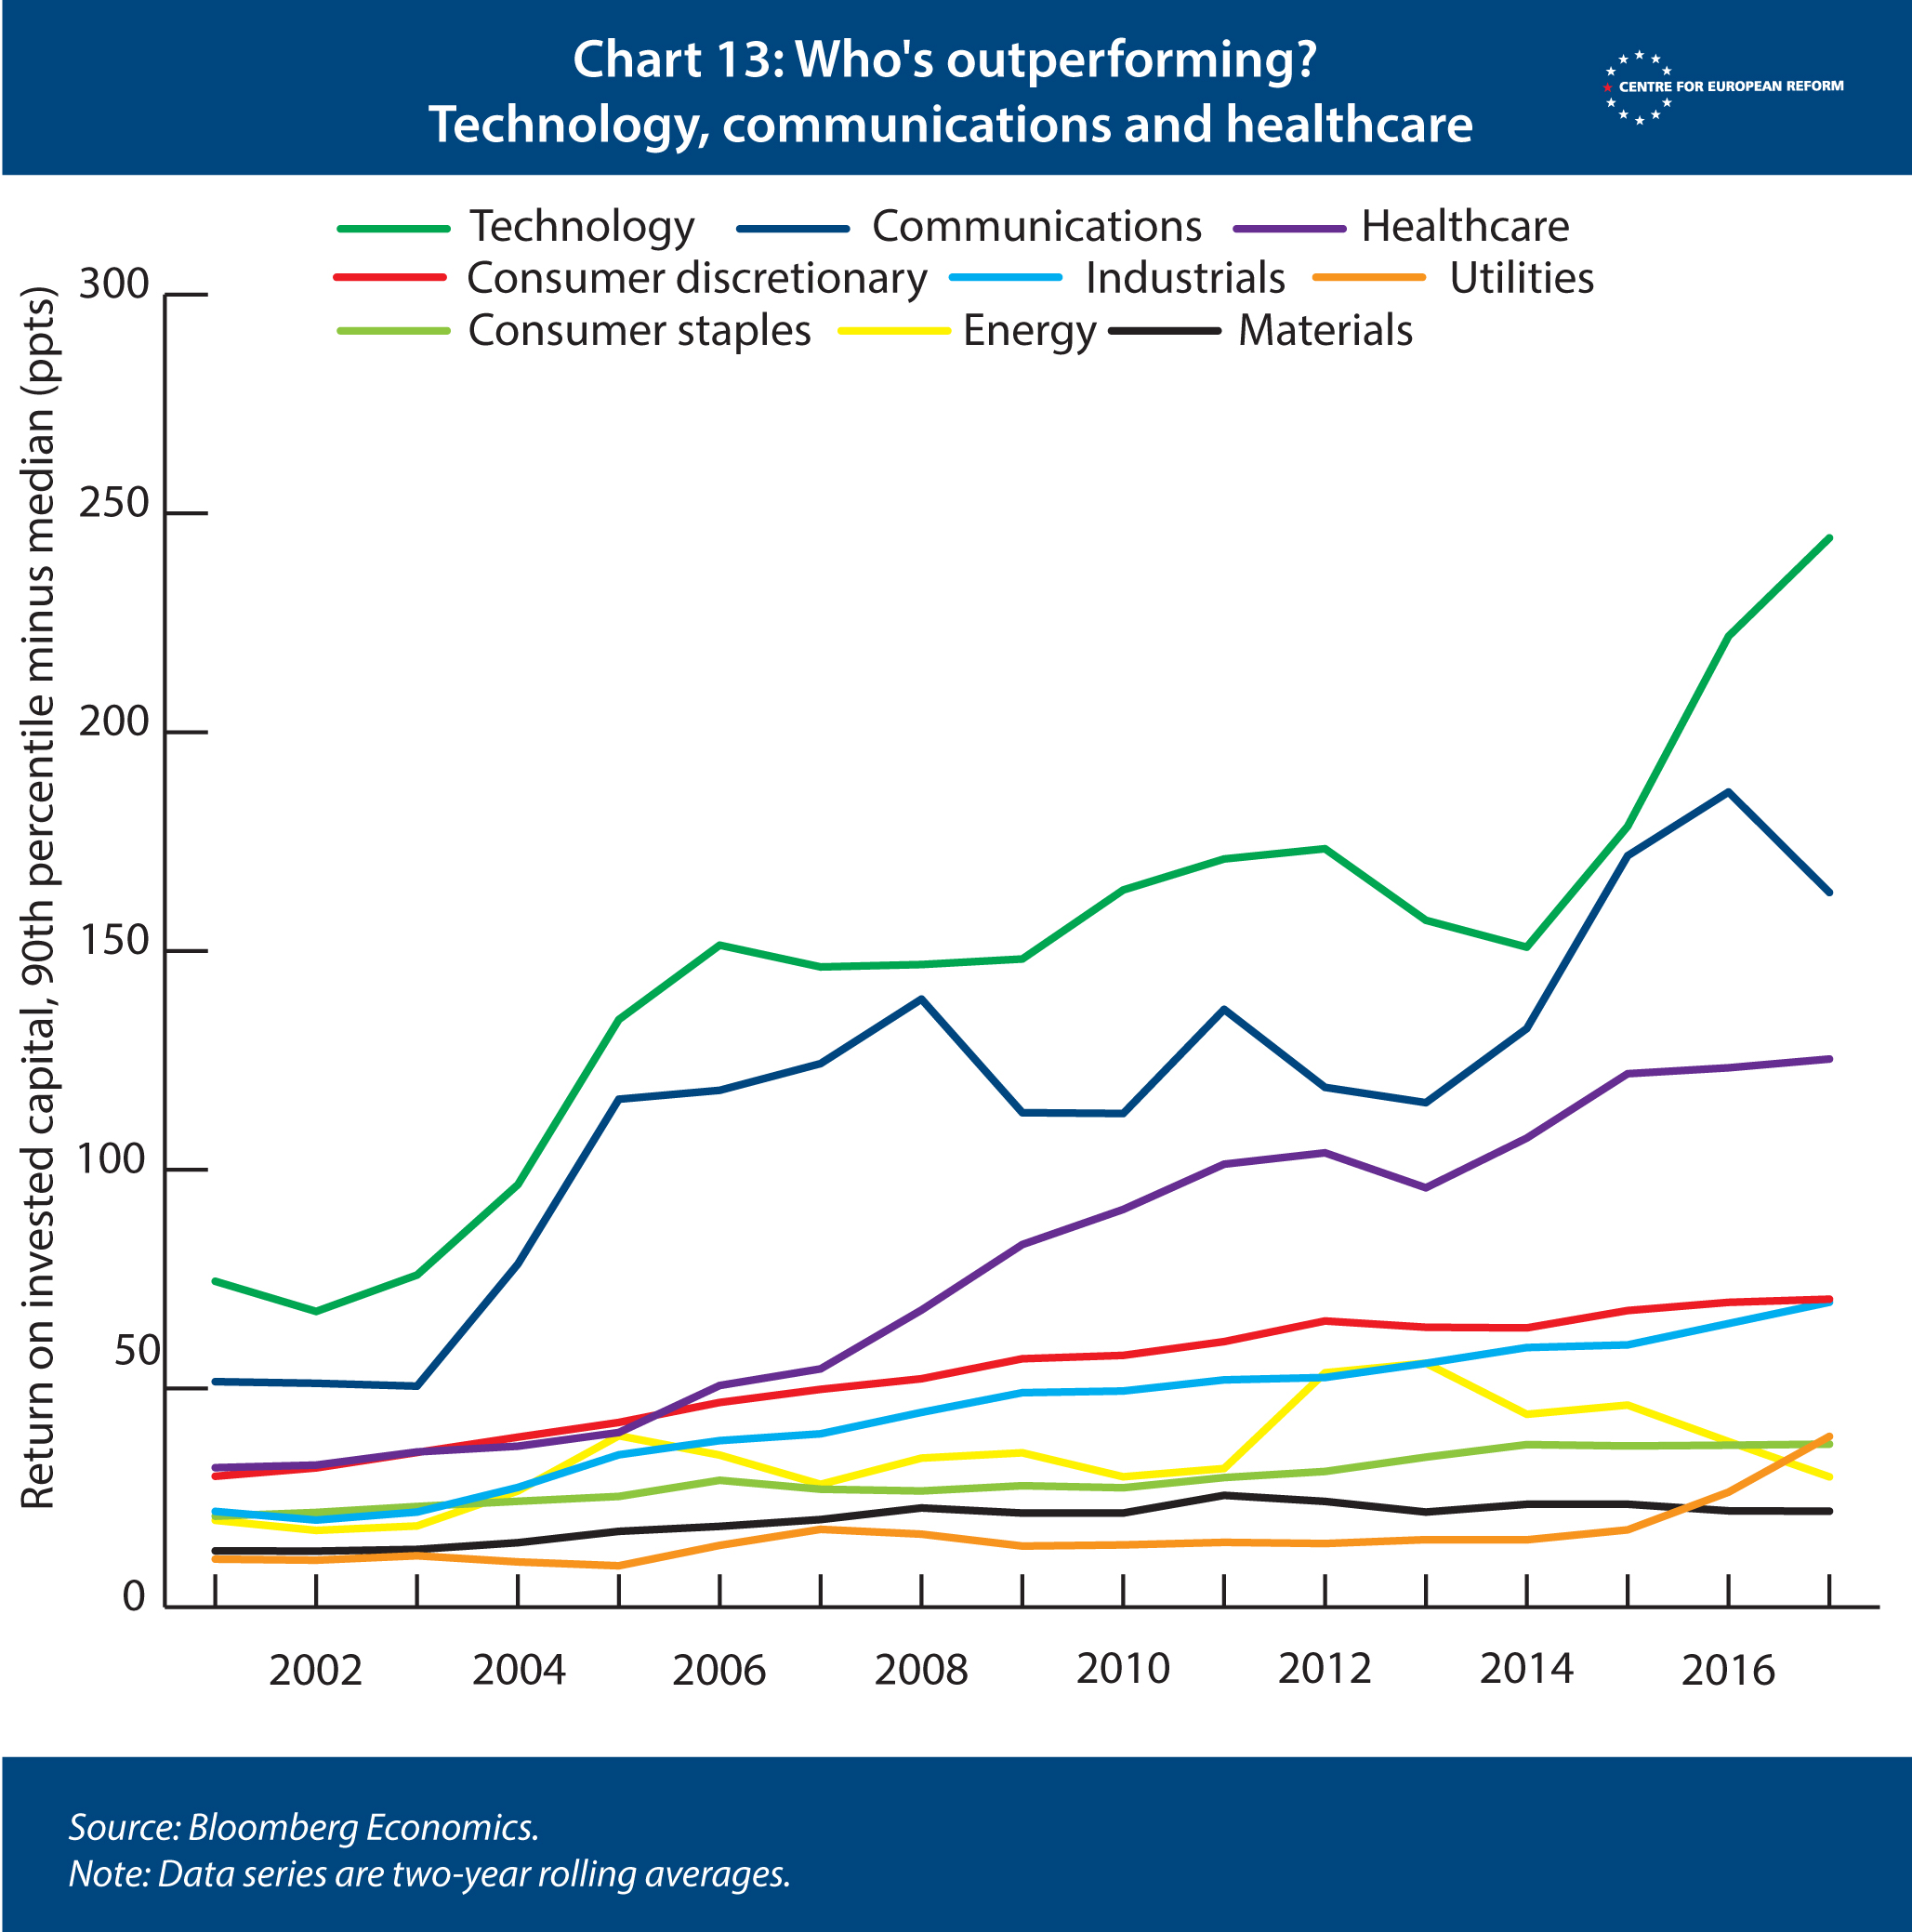
The most profitable companies are thus in research-intensive sectors like pharmaceuticals, medical devices as well as information and other technology. The nature of their work requires these firms to have access to a large pool of highly educated labour. This is why, as our analysis above shows, these companies have been clustering together in more successful city-regions. Below we show why some regions are more productive than others. The level of education of a region’s workforce is the most important factor, and highly productive places are attracting more graduates over time.
Why ‘clustering’ does and doesn’t matter in Europe
In the future, will big cities generate higher productivity, higher profits and higher wages? Cities allow companies and workers to cluster together. Companies get the benefit of a large pool of potential workers, and can select the most productive ones for jobs. They can also cut the costs of services and goods that they need, because there is plenty of nearby competition between other firms seeking to supply them. With so many companies to choose from, workers can more easily find one that best fits their skills. And people can more easily learn from one another in cities than in the country: they might bring new knowledge with them from their old job, or they might be able to borrow from other companies.9
What constitutes a ‘cluster’ is different from sector to sector. Manufacturing clusters tend to be spread out across a region, comprising several cities and the surrounding areas. Services clusters tend to be limited to cities, or even parts of large cities.
We know from existing research in the US that cities are more productive than towns and rural areas.10 The story in Europe is more nuanced. Capital cities seem to have a productivity bonus, but larger cities, towns and the countryside have similar levels of productivity.
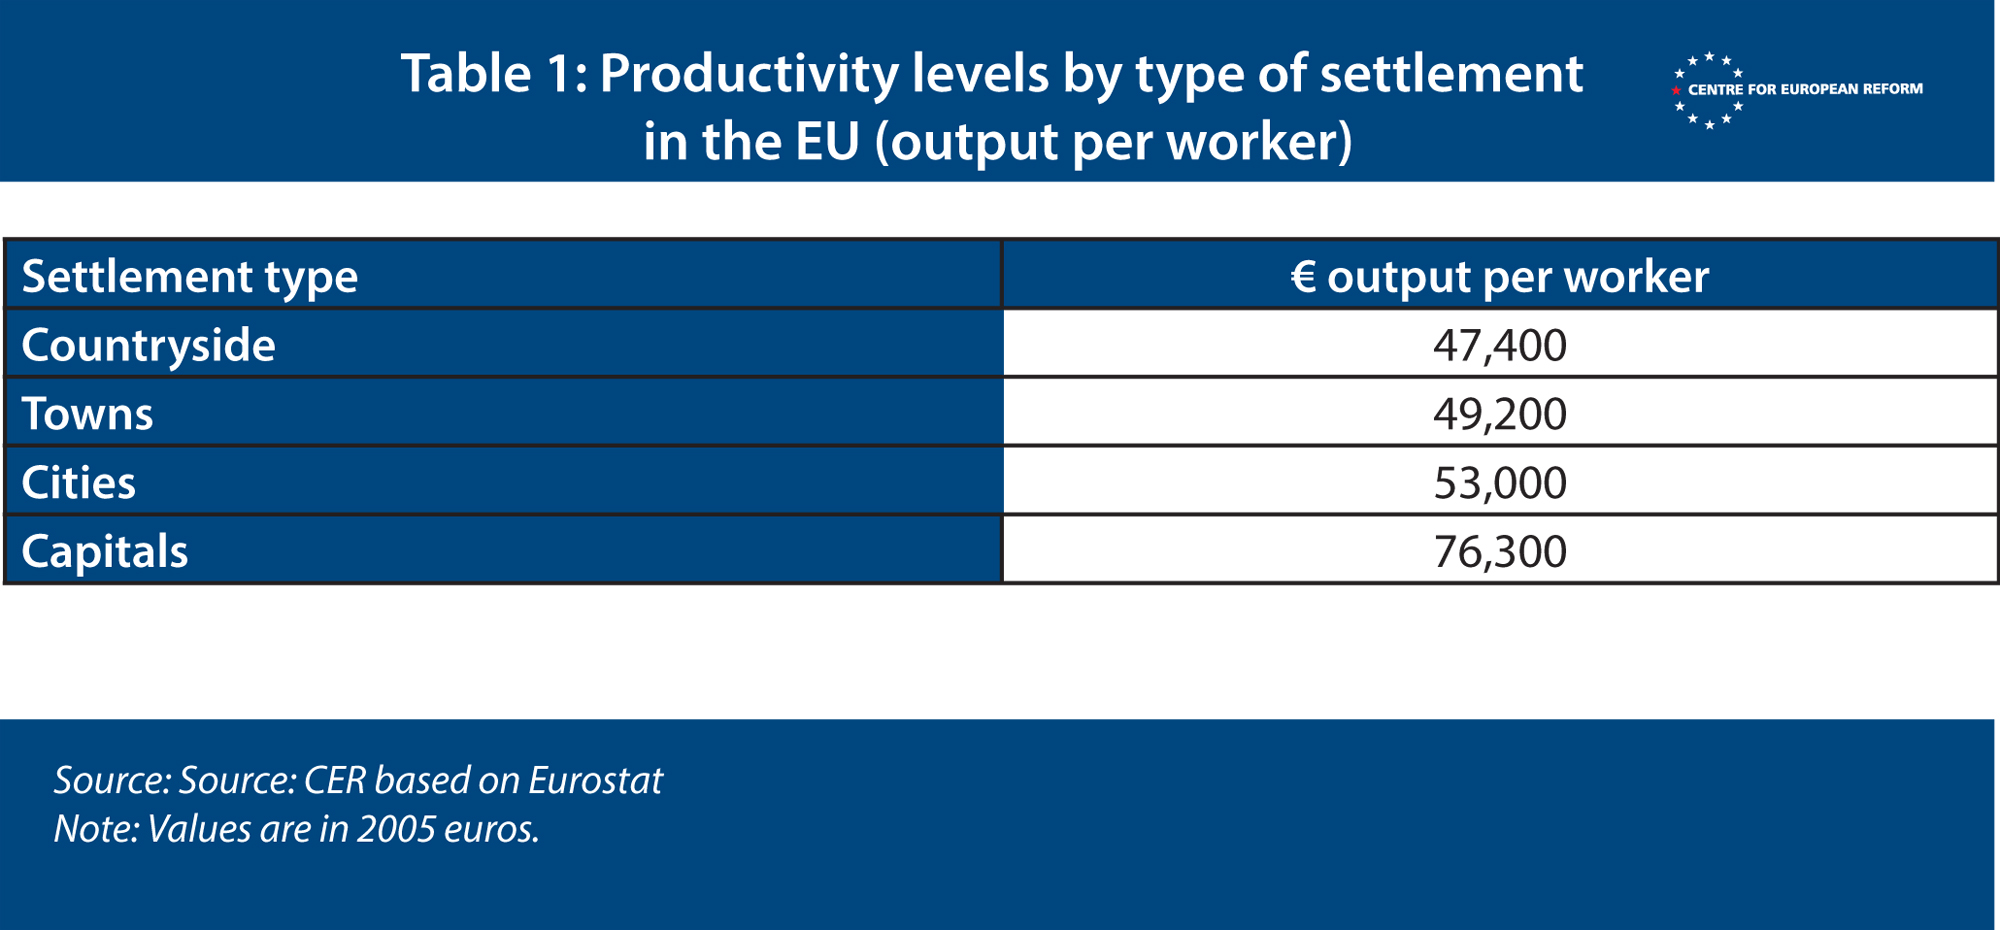
To explain what is behind those productivity numbers, we need to look at the characteristics of people who live in cities, towns and the countryside, and how remote these regions or cities are. The average age and education of the region’s population will make a difference to its productivity. It is also important to control for more sparsely populated places that are close to highly productive cities, such as the small towns that are less than an hour from Brussels by train. These regions will tend to be highly productive, despite being not very densely populated, because economic activity spills over into the countryside around Europe’s successful cities.
Chart 14 shows the results of a regression analysis that controls for these things, and the country in which the region is located.11 In essence, we have considered the extent to which a region’s level of productivity is determined by the age of its population, the proportion of graduates who live there, how densely populated it is, and how economically ‘close’ it is to other regions. We constructed the last factor, essentially as a ‘gravity’ measure of whether a region is in or close to a large city, in order to deal with the small Belgian town issue.12 If the line on the chart is positive, it means that factor improves productivity; and if it is negative, the opposite.
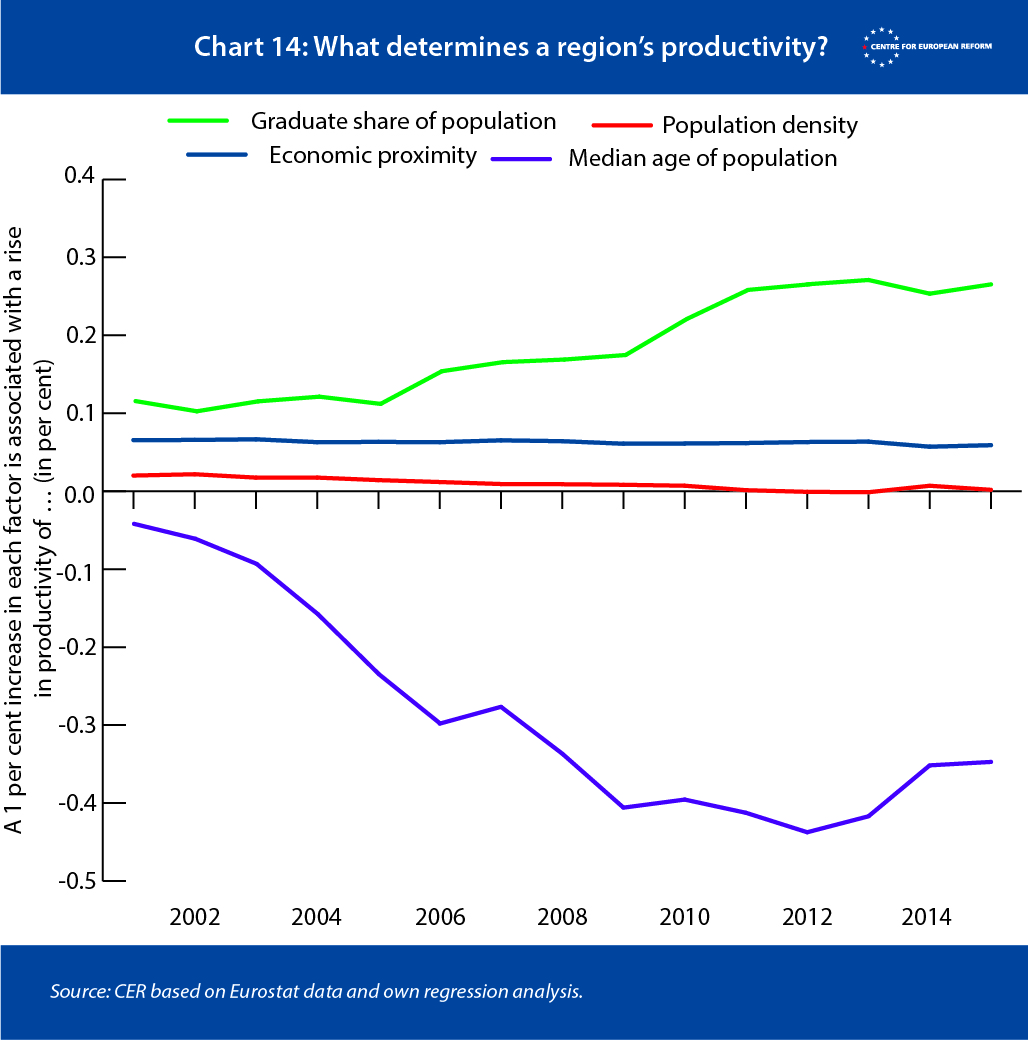
It turns out that the population density of a place does not matter much for productivity; what is far more important is that it is close to other economically successful places. City-regions, which include commuting zones around them, are the relevant unit of analysis.
But the age and the education of the population are the most important factors. A 1 per cent rise in the share of the population with university degrees was associated with a rise in productivity of 0.2 per cent today. (We cannot say that more graduates cause higher productivity, because it may be that graduates move to more highly productive places in search of work.) The effect is much stronger today than it was in the past – which could either mean that graduates are increasingly productive, or more probably, that graduatesare increasingly clustering together in economically successful places. The age effect has also changed over time: in the past, older regions tended to be more productive. Today, the regions with the younger population are more productive. It is unlikely that the young became more productive that quickly, so the reason is more likely a clustering of the young in the successful places.
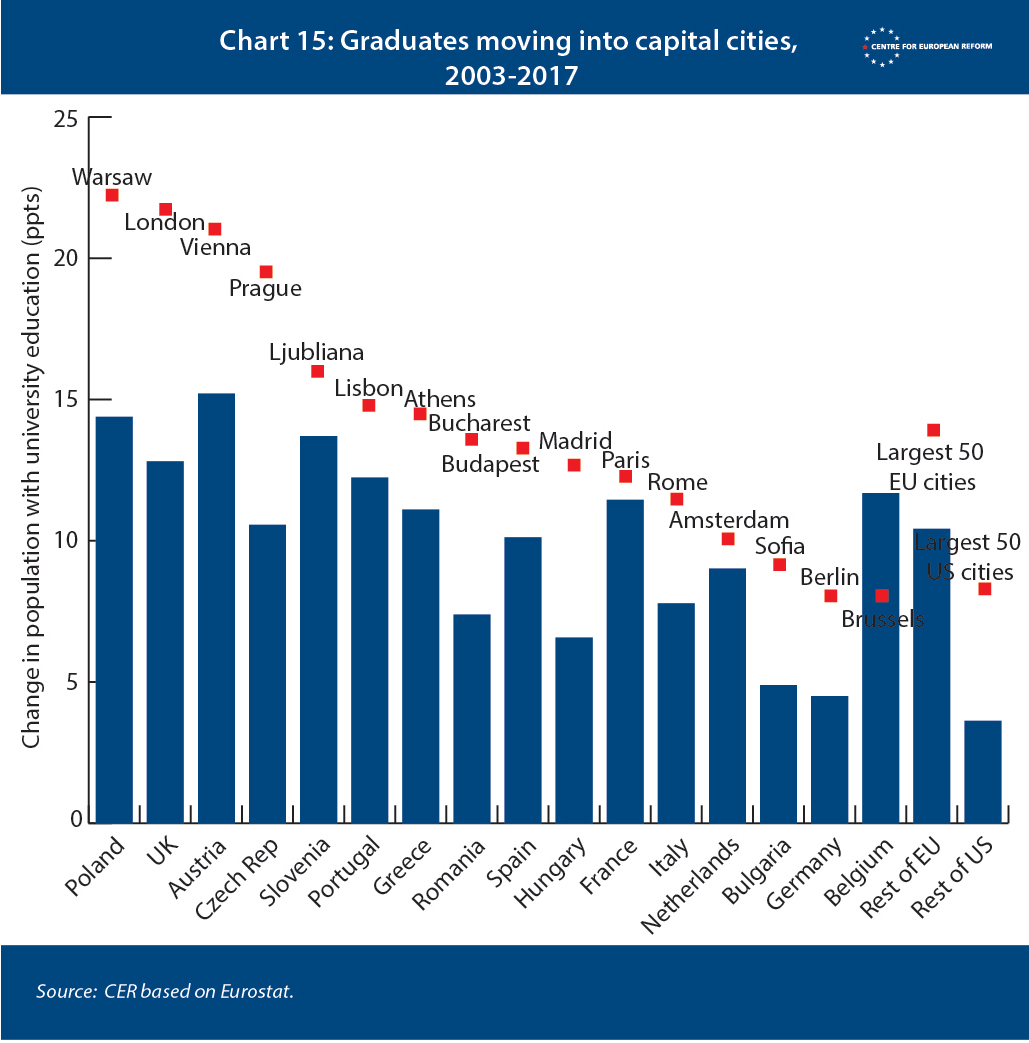
We show this winnowing of the population into educated and less-educated regions in Chart 15. The big expansion of university education across Europe over the last three decades has meant that the share of graduates has risen sharply in most countries (although there are some laggards, such as Italy). The rise in the graduate share in each country is shown by the blue bars. But the rise has been faster in capitals and other large cities, as shown by the red dots.
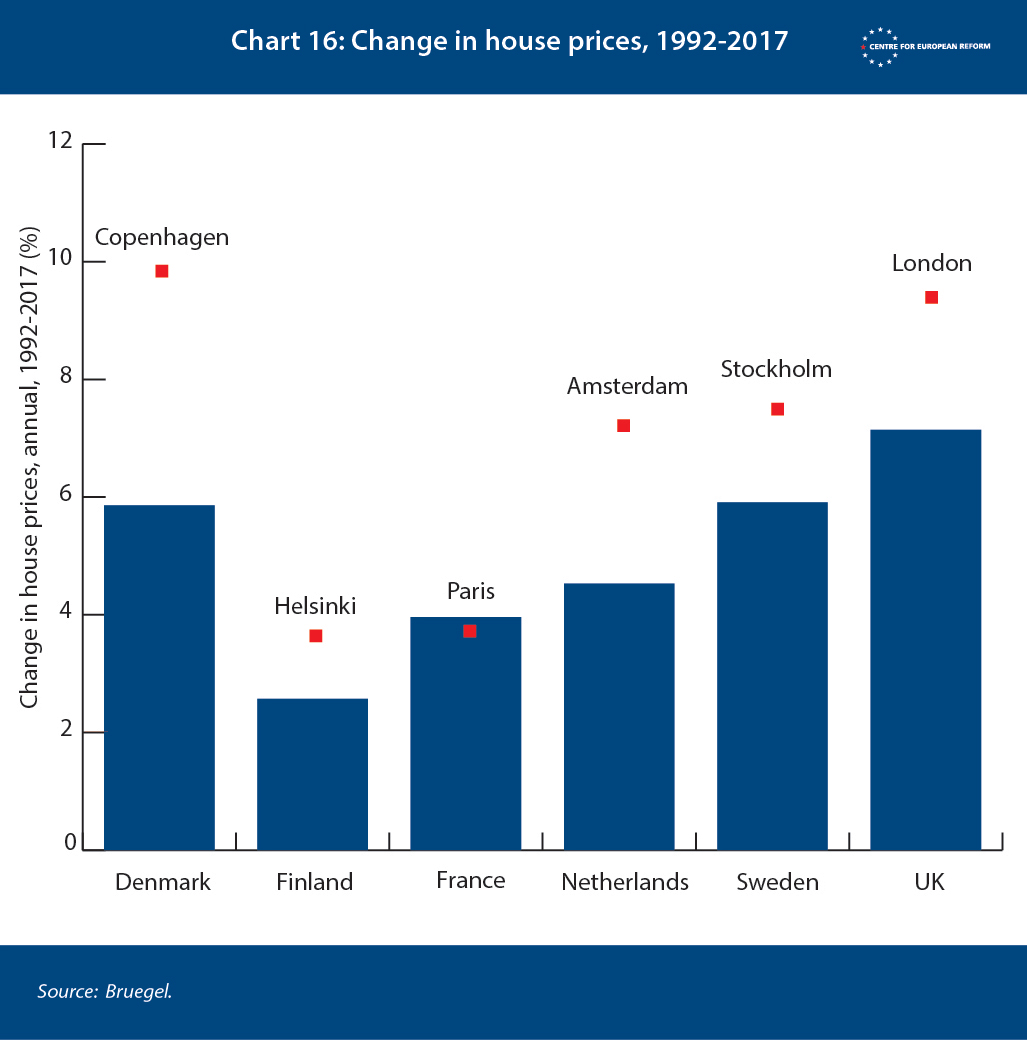
The clustering of services and technology companies and highly-skilled workers is evident in changes in house prices. House prices are in part determined by how productive people are in their vicinity: that is why a small flat in central Paris can cost more than a large house in rural France. While data on regional house prices across Europe is patchy, we can see how rising productivity in capital cities translates into strong house price growth – especially in the services-dominated economies of northern Europe (Chart 16). Regional differences in house prices reinforce population sorting: young graduates are willing to live in small, expensive flats for a while in order to establish their careers in costly cities. Fewer less-educated people have the means or the inclination to take that risk.
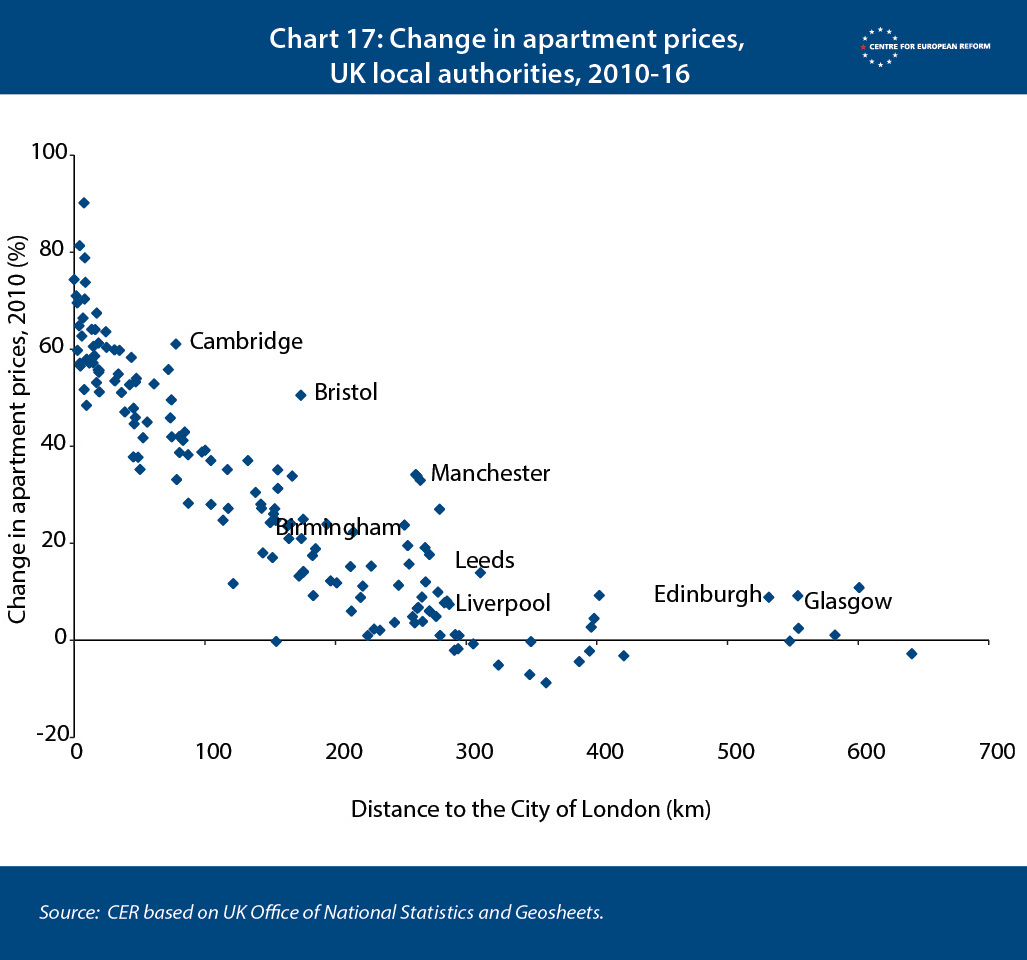
In the UK, this pattern of house price growth is particularly striking, and underlines the importance of being close to a highly productive city. Since 2010, a big determinant of house price growth, in almost all areas, has been how far it is from the City of London (Chart 17). Only a few other successful cities, such as Cambridge, Bristol and Manchester, bucked the trend.
At least in part, the surge in house prices in cities is the result of investors speculating that Europe’s major cities – with a more youthful and well-educated workforce – will see faster economic growth in the future. That may be good news for investors, but it poses major challenges to Europe’s policy-makers.
Conclusion
The debate about the causes of the rise of populism in the West has understandably focused on high unemployment and slow growth since the 2008 crash. Proponents of economic explanations for the rise of populism have noted that people in regions with high unemployment have been more likely to vote for anti-EU and anti-immigration parties.13 Their opponents point out that the best predictors of why a voter supports populists are not where they live or their economic circumstances, but their level of education, their age and their cultural and moral outlook.14 A moderately well-off 70 year-old Londoner without a university education was as likely to vote for Brexit as an equivalent voter in Wolverhampton.
Both sides of the debate have paid too little attention to clustering, which is in turn stimulated by the rise of services and high-tech firms. High value-added services and technology firms have a greater tendency to cluster closely together than manufacturing firms, the latter tends to spread out over space, as companies seek cheaper land and labour. Successful city-regions are gobbling up graduates and young people, and this trend seems to be increasing: output in business services has become more unequal across regions since the financial crisis, and education has become more strongly associated with productivity over time. This means that Europeans are being sorted both politically and economically, as well-educated young people are less likely to vote for populist parties than older, less-educated people.
Will this trend continue? In future papers, we will consider how technological changes and globalisation might affect growth and inequality across the EU’s member-states and regions, and whether these changes will tend to aggravate or soothe political tensions in Europe.
It may be that the geography of services and technology markets will always be different to manufactured goods, in which case the sorting that we have started to observe in Europe will continue. However, some forecast that automation and artificial intelligence will allow services companies to offshore production, with a doctor or a robot in a low-cost country providing remote diagnoses for patients in higher-cost countries, for example.
In the past, industrialisation was the main way in which poorer countries could catch up with richer ones. However, that method of catch-up may not be so easy in the future: poorer countries and regions of Europe may struggle to attract, train and retain the skilled people they need to build highly productive services and technology clusters. The well-to-do, smaller towns and the very largest cities may continue to attract the highly skilled, while the rest could well struggle.
But the ‘big European sort’ has already posed a challenge to Europe’s policy-makers: should they try to encourage people to move to successful cities in their own country and abroad? Moving to a more productive place may provide people with a boost to their income. Should governments instead invest in the medium-sized places that have seen economic stagnation or even decline, to try to stem the emigration of young, educated people? Or is there a middle ground: improve transport connections to allow more people to commute to productive places, thus extending the reach of the highly productive cities?
And what are the growth strategies that should be pursued by regions that are struggling to create plenty of high-skilled services jobs? This may be especially challenging for countries with strong demographic change (such as the Central and East European countries that are losing young people to the West), or in Southern Europe, where several countries face the double whammy of ageing and the scars of a severe economic crisis. We will seek to answer these questions in forthcoming papers.
2: Bill Bishop, ‘The big sort: Why the clustering of like-minded Americans is tearing us apart’, Mariner Books, 2009.
3: A Gini index of 100 would mean that one person in a country received all of the country’s income. A Gini index of 0 would mean that all people’s incomes were the same.
4: Martin Sandbu, ‘Hyperglobalisation and its critics’, Financial Times, January 30th 2019.
5: Eurozone central and north: Belgium, Germany, Ireland, France, Luxembourg, Netherlands, Austria, Finland. Eurozone south: Greece, Italy, Spain, Portugal. Newer member-states: Bulgaria, Czech Republic, Estonia, Croatia, Cyprus, Latvia, Lithuania, Hungary, Malta, Poland, Romania, Slovenia, Slovakia. Non-eurozone north: Denmark, Sweden, United Kingdom. Each country group is weighted by individual countries’ GDP, as is the EU-28 average.
6: To answer this question, we have used the smallest ‘NUTS 3’ regions for which the EU collects data. These regions range in size from as little as 8,000 citizens to 5 million (the average is 360,000 inhabitants). These regions are typically based on local administrative boundaries, such as 402 Landkreise in Germany, 96 départements in France, 101 provincie in Italy and 57 provincias in Spain. They are not identical in size across countries, but they do provide a useful delineation to study regional divergences across Europe.
7: The labels ‘countryside, towns, cities and capitals’ are based on definitions by Eurostat. In essence, the definition of countryside and towns follows from the share of the population of a region that is classified as rural. ‘Cities’ are based on European metropolitan areas. For our charts here, all regions with at least 50 per cent inside a metropolitan area are considered part of that city. Capitals are the metropolitan areas that are also capitals. The exception is Amsterdam, which we cheekily classified as a capital.
8: Tower Hamlets, Lewisham and Southwark, Haringey and Islington are all part of London.
9: Fredrik Anderson and others, ‘Cities, matching and the productivity gains of agglomeration’, Journal of Urban Economics, January 2007.
10: Kristian Behrens and others, ‘Productive cities: Sorting, selection, and agglomeration’, Journal of Political Economy, 2014.
11: Germany is more productive than Greece, but we are only interested here in the characteristics of regions themselves, not the country the region is in. So we strip out the average level of German productivity from German regions, Greek average productivity from Greek regions and so forth. We repeat that regression for each year.
12: The gravity equation from physics is the basis of this measure. The product of the masses of two objects, divided by the square of the distance between them determines gravity. Translated to our setting, we use the gross value-added of two regions and the distance between them. We calculate the gravity between all possible pairs of regions in Europe, and sum those up for each region, to calculate a measure of economic closeness to other regions. The larger the region is economically, and the closer it is to other economically large regions, the higher the closeness measure.
13: Yann Algan and others, ‘The European trust crisis and the rise of populism’, Brookings Papers on Economic Activity, Autumn 2017 and Lewis Dijkstra and others, ‘The geography of EU discontent’, European Commission Working Papers, 2018.
14: Eric Kaufman, ‘It’s NOT the economy, stupid: Brexit as a story of personal values’, London School of Economics, July 2016, and Ronald Inglehart and Pippa Norris, ‘Trump, Brexit and the rise of populism: Economic have-nots and the cultural backlash’, Harvard Kennedy School Working Papers, August 2016.
Christian Odendahl, Chief economist, Centre for European Reform , John Springford, Deputy director, Centre for European Reform, Scott Johnson, Economist, Bloomberg Economics and Jamie Murray, Chief European Economist, Bloomberg Economics , May 2019
We are grateful to Gianna Angelopoulos-Daskalaki for her support for this project.
In an earlier version of this paper, we used data from the website of the European Commission that contained erroneous data for the United Kingdom. We are grateful to Tom Forth from TheDataCity for pointing that out, and have updated our regression results and the associated map with the correct UK productivity data from Eurostat. The results of the regression analysis in this paper have changed a little, but the overall analysis remains very similar to our original paper.
View press release
Comments
I have my doubts however about the high positive DfMP for the Amsterdam and Groningen regions in The Netherlands. National statistical bureaus tend to attribute all production of financial institutions to the head office. This leads to insane amounts of Output per Worker for the areas where these head offices are concentrated, e.g. Amsterdam in the case of The Netherlands. It reduces the Output per Worker for all other areas with only branch offices. The numbers for Groningen may be heavily skewed in a similar way because of the presence of the GasUnie headquarters.
I have read British studies on the chances of the "Northern Powerhouse" that go into this problem in more detail.
How much of your "big European sort" is actually an artifact of national statistics?