
Now is the worst time for 'global Britain'
Global trade integration has stalled since the financial crisis, and is unlikely to pick up steam any time soon. In that context, plans for ‘global Britain’ will do little to offset the costs of Brexit.
‘Global Britain’ and the pursuit of a fully independent trade policy has become a fixation for many Conservative MPs. Any mention of a customs union, which would limit the UK’s ability to negotiate away its tariffs in return for increased access to new markets, triggers a hostile reaction. The Conservative party membership, which polls suggest largely consists of hard-line eurosceptics, is likely to select Boris Johnson to be the UK’s next prime minister.
Johnson has championed the idea that Brexit is an opportunity to look outward, and sign trade deals with countries far and wide. Johnson’s choice, if an independent trade policy is indeed his goal, is either to push for a no-deal Brexit, or to abandon the Democratic Unionist Party and press for a Northern Ireland-only backstop, rather than one that includes a UK-EU customs union. Both would free him – theoretically – to pursue trade deals with whichever country he wants.
The problem facing Johnson and his global Britain outriders is that globalisation has stalled for over a decade. Donald Trump’s trade war with China – and the risk that he also targets EU car exports – may even lead to trade disintegration (global trade falling as a proportion of global GDP). There could hardly be a more challenging environment for leaving the EU’s single market and customs union, and attempting to rebuild a trade policy from scratch.
Before the Great Recession began in late 2008, global goods trade rose much faster than global GDP (See Chart 1). Manufacturers built international supply chains, sourcing components from multiple countries. Their suppliers in turn imported their own components and raw materials from multiple countries. As a result, trade grew very rapidly. However, since 2009, trade has grown at around the same rate as GDP.
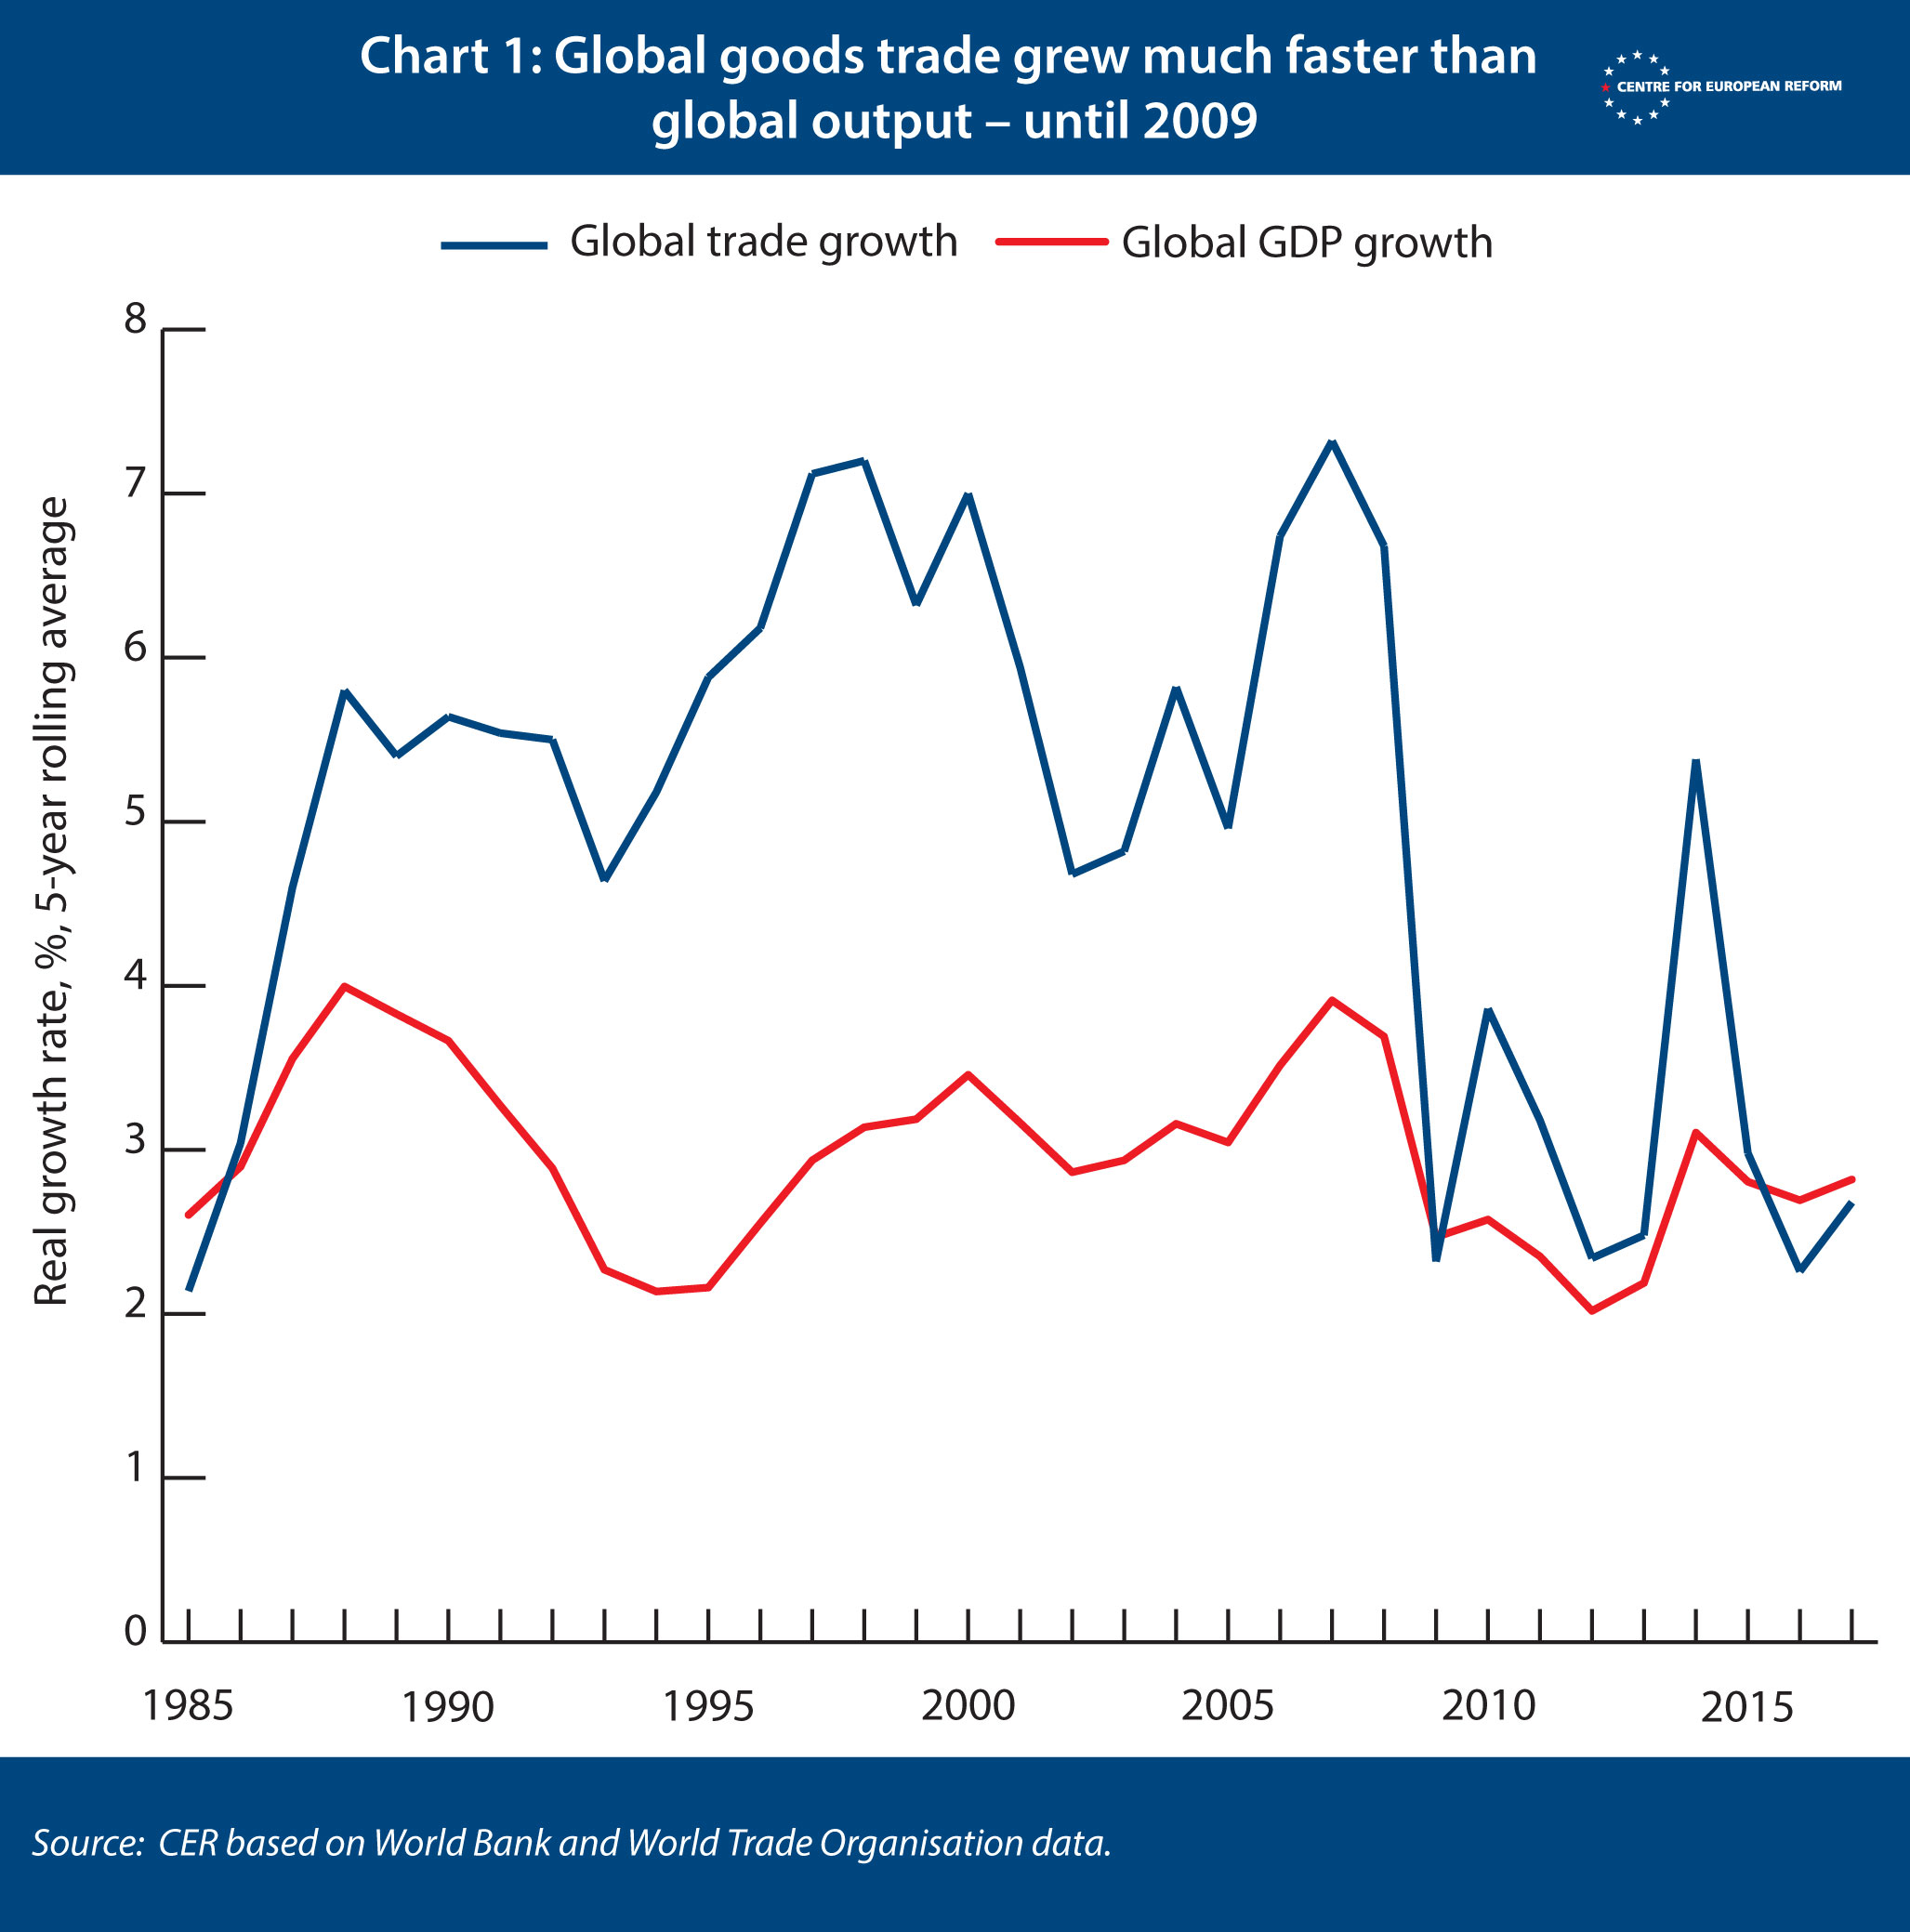
There are two main causes of this fall in trade growth. The most obvious is that the global financial crisis curbed demand: households in the rich world were forced to pay down debts after credit conditions tightened, the large numbers of unemployed spent less on imported goods, and businesses were wary of investing, both at home and abroad. But, more importantly, the integration of China into the global economy meant that the pace of trade growth was unusually high in the 1990s and 2000s. China’s extraordinary rates of investment in manufacturing plants and infrastructure made it a massive importer of oil, iron ore and other commodities. Since the 2010 peak, Chinese investment has fallen from 48 per cent of GDP to 44 per cent (rates in Europe are typically around 20 per cent). In the future, China will have to rebalance its economy away from exports and investment towards domestic household and government consumption.
This is not to say that no efforts have been made to free up trade. The Comprehensive and Progressive Trans-Pacific Partnership (CPTPP), a plurilateral trade agreement between 11 countries, including Australia, Mexico, Japan, Singapore and New Zealand, was agreed in 2018 as a successor to the failed Trans-Pacific Partnership (TPP). The EU has also finalised trade agreements with Canada and Japan, upgraded its deal with Mexico, and has agreements with Singapore and Vietnam close to completion. At the time of writing, the EU is close to a political agreement on a deal with the Mercosur trade bloc (which includes Brazil and Argentina) and has begun trade talks with Australia and New Zealand. Yet the evidence suggests that despite these efforts, barriers to trade remain, and companies are not yet making full use of the existing opportunities. Some of these agreements are also fairly recent, so we will not be able to accurately assess their impact for some years yet.
A closer look reveals that supply chain integration has stalled between advanced economies – and between advanced and emerging economies too. In the 1980s and 1990s, barriers to trade had fallen rapidly, but since around 2005, the cost of trade between most major economies has stopped falling. Barriers to trade come in three forms.
- National policies which governments can address, such as tariffs, different national regulations and laws, and tax regimes.
- Costs borne of geography, culture, distance, time zones and language – which can be reduced but are difficult to overcome entirely.
- Technological barriers such as the (in)efficiency of ports and the inability of teleconferencing systems to fully replicate the face-to-face experience – which may be innovated away in future.
Over the past decade, there has been no economically meaningful improvement in any of those areas.
Chart 2 shows a calculation of the cost of trading goods, expressed as a tariff equivalent. A trade cost of 10 per cent means that trade between two countries adds around 10 per cent to the cost of the good, compared to the distribution of the goods within those countries. (See the appendix below for a brief explanation of the method for calculating the costs). As the chart shows, trade costs have barely fallen between all of the countries examined.
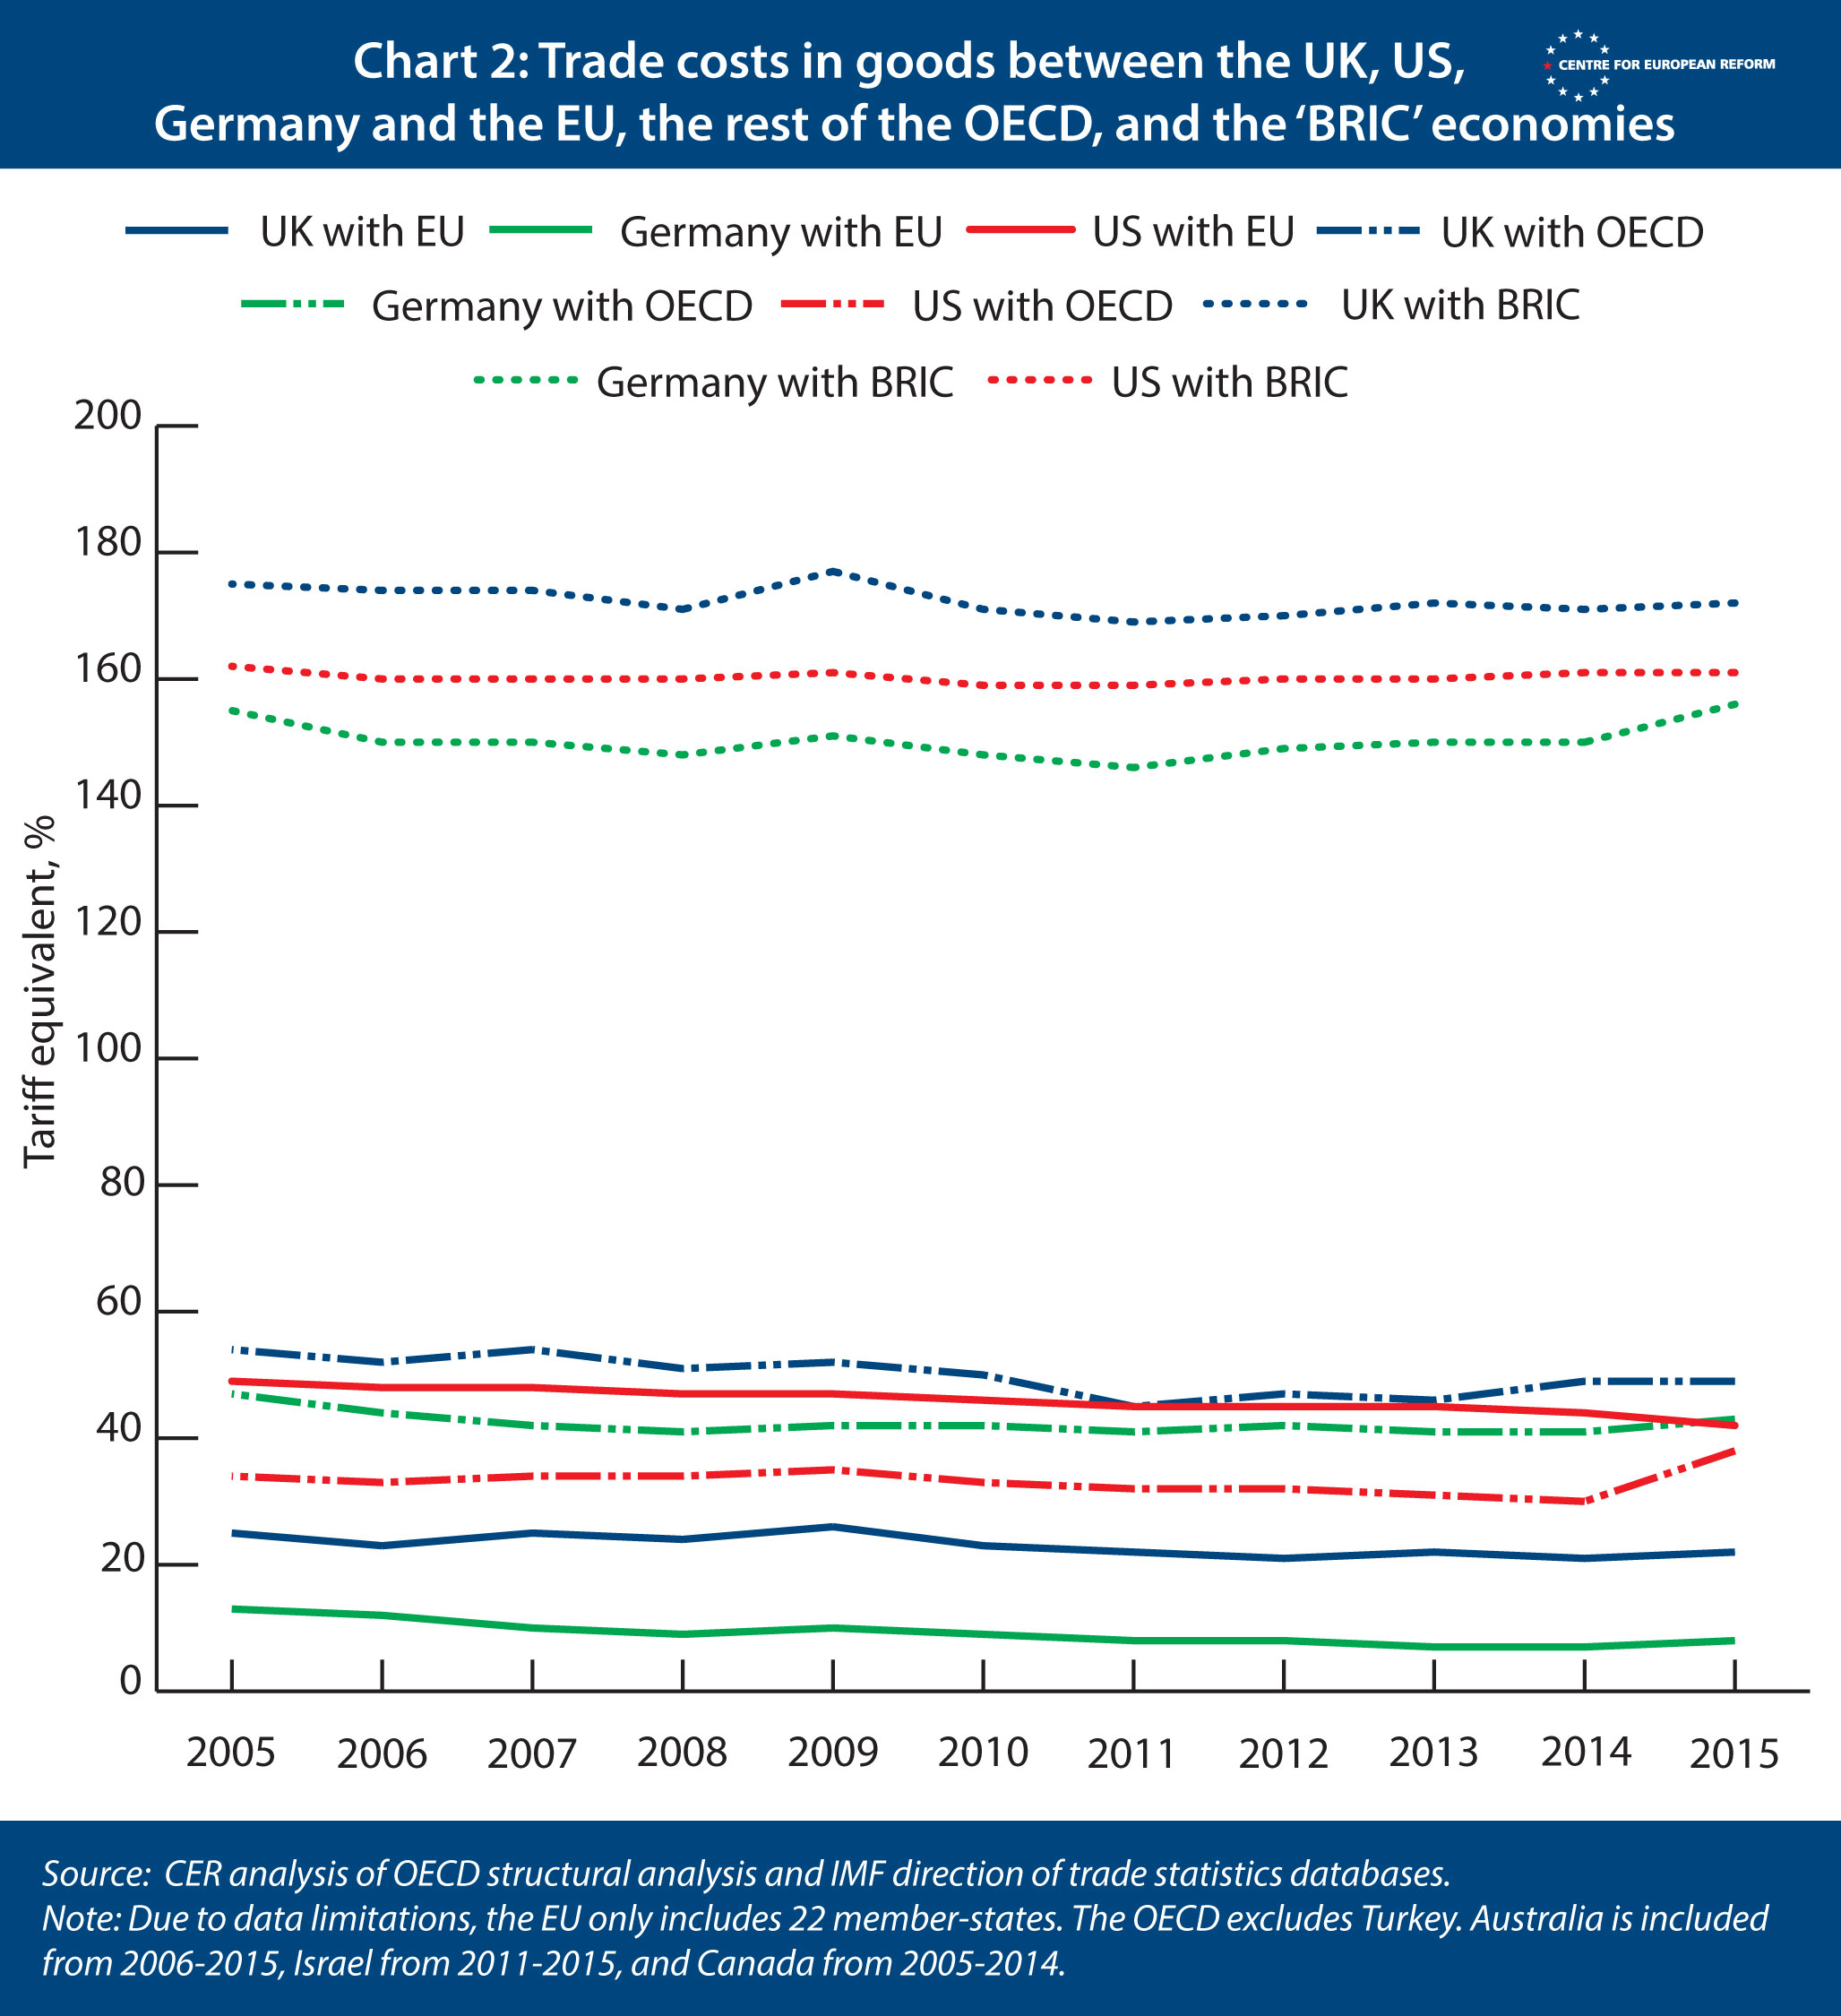
The chart also shows that the EU is the UK’s natural trade partner – Britain is a European country, after all. The EU has been successful in reducing internal barriers to trade. Trade costs between Germany, the UK and the EU are significantly lower than they are between those countries and the rest of the OECD. US trade costs with the rest of the OECD are a little lower than with the EU, reflecting the close proximity of the US to Mexico and Canada, and the free trade agreement between those three countries. And trade costs between the US, Germany, the UK on the one side and the ‘BRIC’ economies on the other are much higher. The reason is that these countries are more distant from one another, and Brazil, Russia, India and China charge higher tariffs and impose other protectionist measures, which inhibit trade.
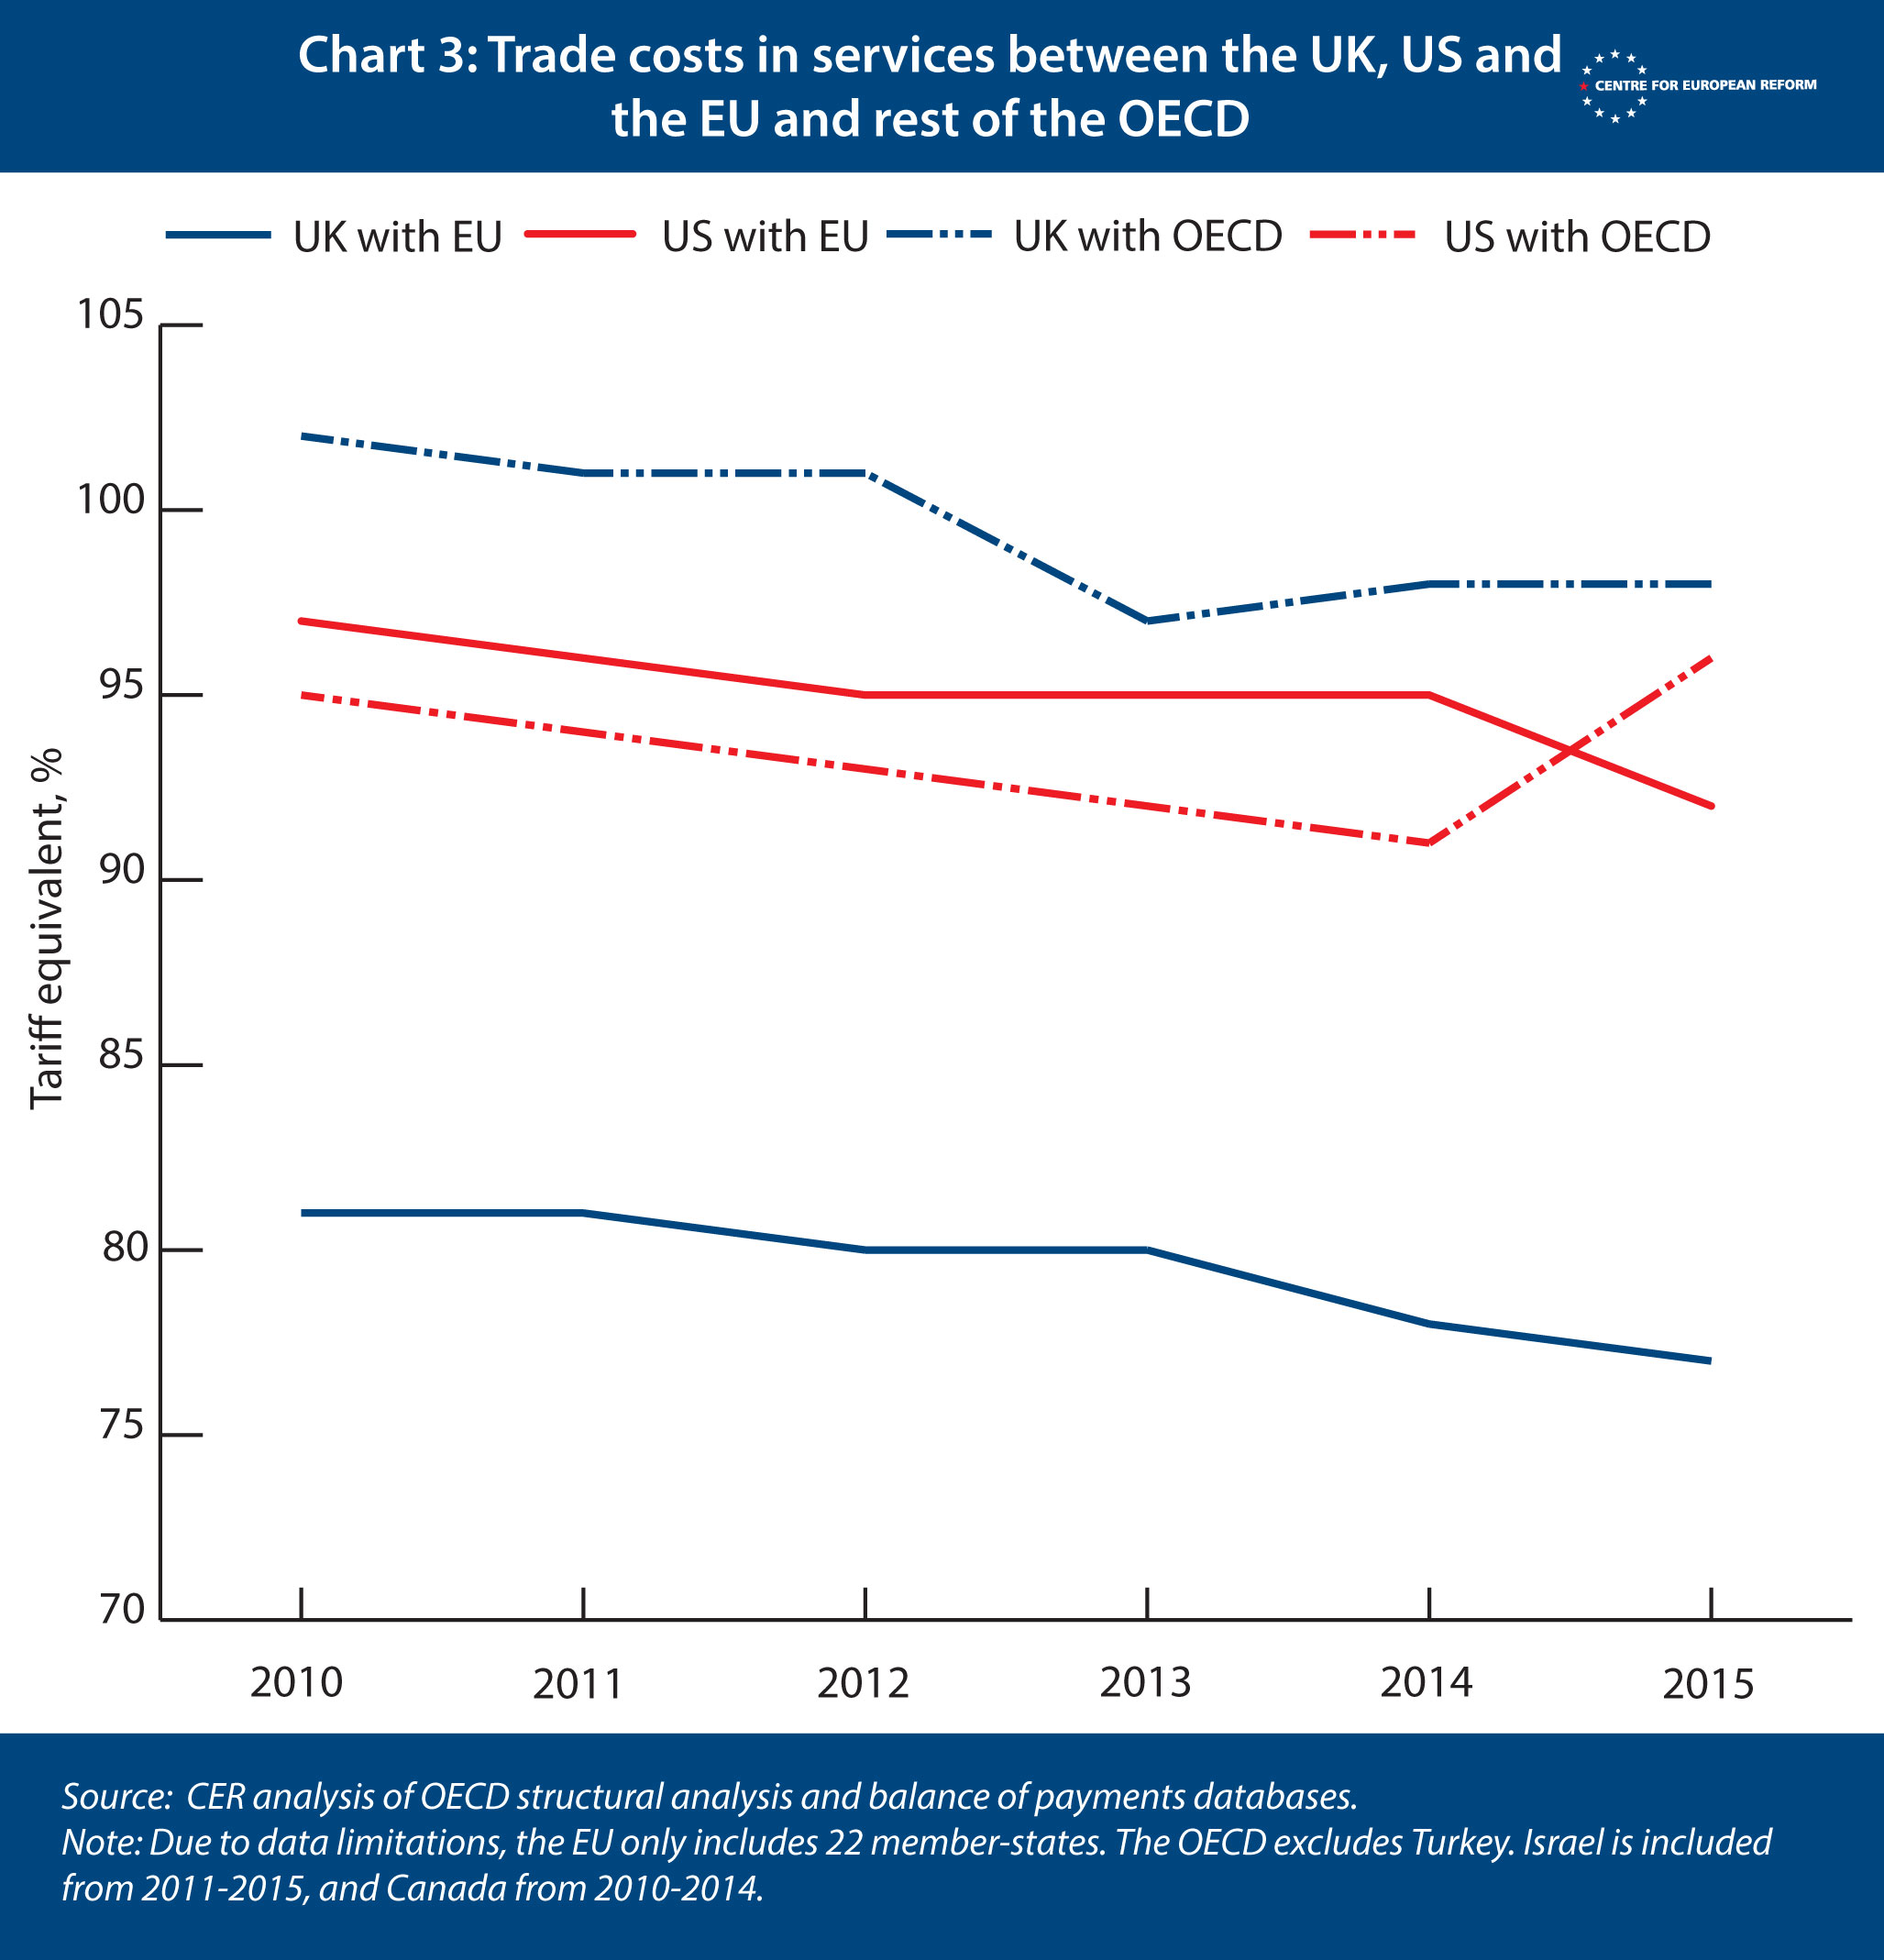
Chart 3 shows the same tariff equivalent trade costs for services trade. (Tariffs aren’t applied to services, but we can apply the same method we have used with goods to estimate trade costs that are equivalent to a hypothetical tariff.) Trade costs in services are much higher than in goods, because services markets are more highly regulated than goods are, and services often need to be delivered personally, making trade difficult. But the ‘tariff’ the UK faces when trading with the EU is much lower than it faces with the rest of the OECD. Britain’s participation in the single market for services has been beneficial – and trade costs have been falling with both the EU and the OECD, albeit slowly.
When – or if – the UK leaves the EU’s single market and customs union, it will raise the cost of trading with the EU. And it is unlikely that Britain will achieve reductions in barriers with the rest of the world that will come close to offsetting the cost of higher barriers with the EU. One reason is that the single market is a uniquely comprehensive trade agreement, thanks to its political institutions. Another is that FTAs will have to be more comprehensive than the single market in order to overcome the fact that the US, China, India and other economies are so distant from Britain.
Moreover, thanks to Trump, there is now a significant risk of trade disintegration. In the 1930s, the Great Depression led to higher tariffs, as countries sought to encourage domestic consumers to buy goods from domestic industries. Trump may open a new front with the EU in his attempt to use tariffs – or the threat of them – to force trade partners to offer more opportunities for American exporters. His administration has sought to hobble the World Trade Organisation, the guardian of rules-based trade. Growing economic competition between China and the US heralds a prolonged period of trade policy uncertainty across the globe, which will further inhibit investment by multinational companies in international supply chains.
Over the three years since the referendum, the likelihood that Brexit could lead to continued single market or customs union membership has receded. The best hope for damage limitation, if the UK goes ahead with Brexit, is that the country avoids the rupture of no deal and negotiates a free trade agreement with the EU that mitigates as much of the cost of single market exit as possible. Talk of ‘seizing the opportunities’ of Brexit is cheap: there are fewer of them around than there used to be.
Appendix
Our measure of trade costs is the ‘inverse gravity’ equation, which was developed by Dennis Novy at the University of Warwick. It is founded on the insight that, if the amount of production that is traded between two countries is growing faster than the amount of production that is consumed domestically in those countries, the ‘cost’ of trade between the two countries is dropping. For example, if car plants are making the same number of cars in two countries, but the two countries are selling more of their cars to one another, barriers to trade between the two economies must be falling. This measure of the trade costs is expressed as a percentage equivalent to a tax rate – such as a tariff. If the cost of trading a widget were zero, it would cost the same to sell that widget abroad as at home.
The equation for calculating the observed ad valorem cost of trade between two countries is:
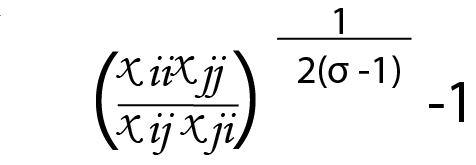
xii and xjj are the gross outputs of the manufacturing or services sectors (x) in the two trade partners (i and j).
xij and xji are the exports and imports of the manufacturing or services sector x between i and j.
σ is a constant elasticity of substitution between imported and domestic products. Novy uses the estimates for this elasticity from elsewhere in the trade literature, and finds σ to be 8.
John Springford is deputy director and Sam Lowe is a senior research fellow at the Centre for European Reform.
Add new comment